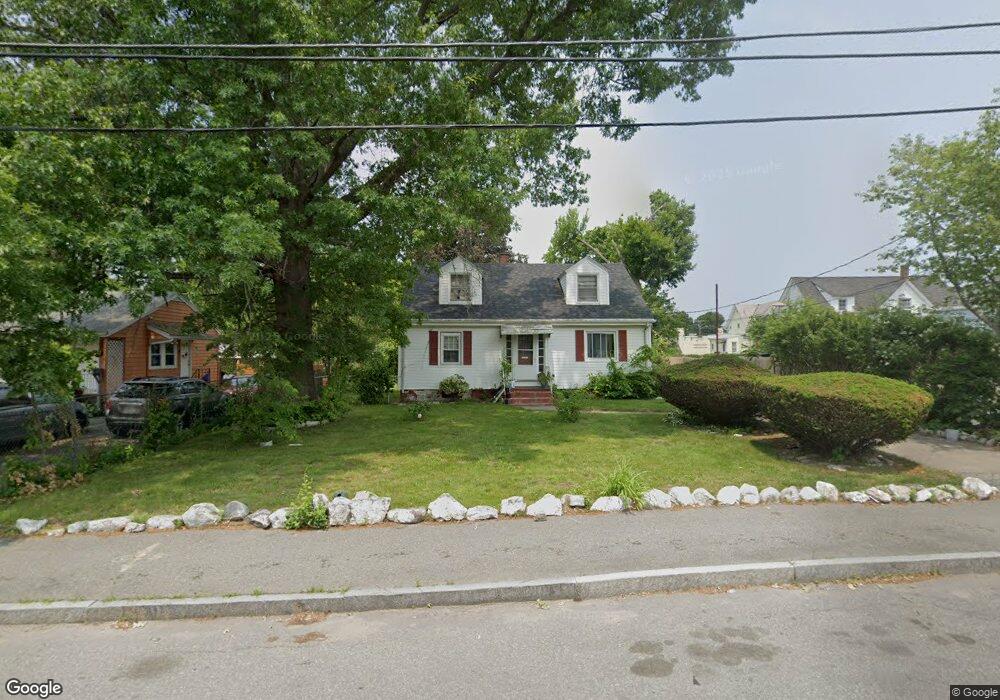
11 Menlo St Brockton, MA 02301
Clifton Heights NeighborhoodEstimated Value: $578,652 - $692,000
3
Beds
2
Baths
1,428
Sq Ft
$445/Sq Ft
Est. Value
About This Home
This home is located at 11 Menlo St, Brockton, MA 02301 and is currently estimated at $635,913, approximately $445 per square foot. 11 Menlo St is a home located in Plymouth County with nearby schools including John F. Kennedy Elementary School, Davis K-8 School, and South Middle School.
Ownership History
Date
Name
Owned For
Owner Type
Purchase Details
Closed on
Aug 9, 1993
Sold by
Fhlmc
Bought by
Marshall Patricia B
Current Estimated Value
Purchase Details
Closed on
May 10, 1993
Sold by
Ossai Daniel and Federal Home Loan Mortgage Cor
Bought by
Fhlmc
Purchase Details
Closed on
Oct 27, 1988
Sold by
Hodges James L
Bought by
Ossai Daniel U
Create a Home Valuation Report for This Property
The Home Valuation Report is an in-depth analysis detailing your home's value as well as a comparison with similar homes in the area
Home Values in the Area
Average Home Value in this Area
Purchase History
| Date | Buyer | Sale Price | Title Company |
|---|---|---|---|
| Marshall Patricia B | $38,110 | -- | |
| Fhlmc | $150,951 | -- | |
| Ossai Daniel U | $137,900 | -- |
Source: Public Records
Mortgage History
| Date | Status | Borrower | Loan Amount |
|---|---|---|---|
| Open | Ossai Daniel U | $246,500 | |
| Closed | Ossai Daniel U | $82,000 | |
| Closed | Ossai Daniel U | $15,000 |
Source: Public Records
Tax History Compared to Growth
Tax History
| Year | Tax Paid | Tax Assessment Tax Assessment Total Assessment is a certain percentage of the fair market value that is determined by local assessors to be the total taxable value of land and additions on the property. | Land | Improvement |
|---|---|---|---|---|
| 2025 | $6,625 | $547,100 | $141,200 | $405,900 |
| 2024 | $6,456 | $537,100 | $141,200 | $395,900 |
| 2023 | $5,947 | $458,200 | $110,000 | $348,200 |
| 2022 | $6,035 | $432,000 | $100,100 | $331,900 |
| 2021 | $5,206 | $359,000 | $84,400 | $274,600 |
| 2020 | $4,559 | $300,900 | $77,800 | $223,100 |
| 2019 | $5,142 | $330,900 | $75,500 | $255,400 |
| 2018 | $4,574 | $284,800 | $75,500 | $209,300 |
| 2017 | $4,489 | $278,800 | $75,500 | $203,300 |
| 2016 | $4,038 | $232,600 | $73,600 | $159,000 |
| 2015 | $3,528 | $194,400 | $73,600 | $120,800 |
| 2014 | $3,439 | $189,700 | $73,600 | $116,100 |
Source: Public Records
Map
Nearby Homes