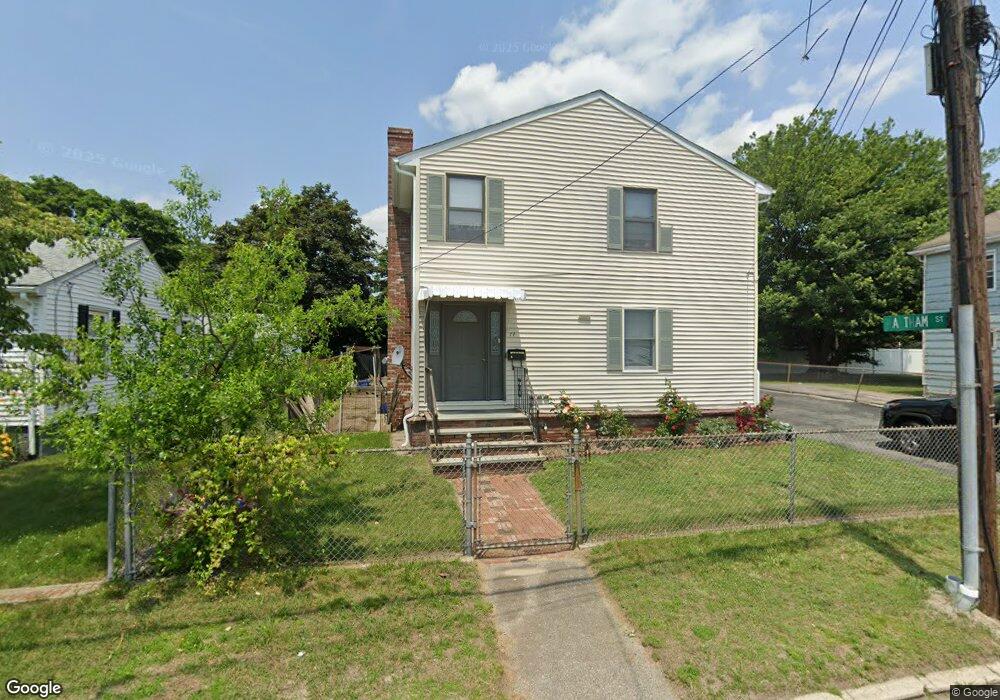
11 Milford St Cranston, RI 02910
Eden Park NeighborhoodEstimated Value: $466,000 - $517,000
5
Beds
3
Baths
2,268
Sq Ft
$214/Sq Ft
Est. Value
About This Home
This home is located at 11 Milford St, Cranston, RI 02910 and is currently estimated at $486,236, approximately $214 per square foot. 11 Milford St is a home located in Providence County with nearby schools including Daniel D. Waterman School, Park View Middle School, and Cranston High School East.
Ownership History
Date
Name
Owned For
Owner Type
Purchase Details
Closed on
May 5, 2009
Sold by
Wells Fargo Bank Na
Bought by
Tan Yan Ru
Current Estimated Value
Home Financials for this Owner
Home Financials are based on the most recent Mortgage that was taken out on this home.
Original Mortgage
$121,400
Outstanding Balance
$76,414
Interest Rate
4.86%
Mortgage Type
Purchase Money Mortgage
Estimated Equity
$409,822
Purchase Details
Closed on
Oct 2, 2008
Sold by
Gomes Olga and Gomes Victor
Bought by
Wells Fargo Bank Na
Purchase Details
Closed on
Jul 1, 1997
Sold by
Dasilva Manuel J and Dasilva Adilia
Bought by
Gomes Olga I
Create a Home Valuation Report for This Property
The Home Valuation Report is an in-depth analysis detailing your home's value as well as a comparison with similar homes in the area
Home Values in the Area
Average Home Value in this Area
Purchase History
| Date | Buyer | Sale Price | Title Company |
|---|---|---|---|
| Tan Yan Ru | $158,000 | -- | |
| Wells Fargo Bank Na | $165,500 | -- | |
| Gomes Olga I | $95,000 | -- |
Source: Public Records
Mortgage History
| Date | Status | Borrower | Loan Amount |
|---|---|---|---|
| Open | Gomes Olga I | $121,400 | |
| Previous Owner | Gomes Olga I | $315,000 | |
| Previous Owner | Gomes Olga I | $275,500 | |
| Previous Owner | Gomes Olga I | $100,000 |
Source: Public Records
Tax History Compared to Growth
Tax History
| Year | Tax Paid | Tax Assessment Tax Assessment Total Assessment is a certain percentage of the fair market value that is determined by local assessors to be the total taxable value of land and additions on the property. | Land | Improvement |
|---|---|---|---|---|
| 2025 | $5,882 | $423,800 | $106,400 | $317,400 |
| 2024 | $5,768 | $423,800 | $106,400 | $317,400 |
| 2023 | $5,356 | $283,400 | $70,100 | $213,300 |
| 2022 | $5,246 | $283,400 | $70,100 | $213,300 |
| 2021 | $5,101 | $283,400 | $70,100 | $213,300 |
| 2020 | $4,933 | $237,500 | $66,700 | $170,800 |
| 2019 | $4,933 | $237,500 | $66,700 | $170,800 |
| 2018 | $4,819 | $237,500 | $66,700 | $170,800 |
| 2017 | $4,694 | $204,600 | $60,100 | $144,500 |
| 2016 | $4,593 | $204,600 | $60,100 | $144,500 |
| 2015 | $4,593 | $204,600 | $60,100 | $144,500 |
| 2014 | $4,545 | $199,000 | $60,100 | $138,900 |
Source: Public Records
Map
Nearby Homes
- 10 Woburn St
- 105 Broadmoor Rd
- 81 Allen Ave
- 15 Spruce Ave
- 150 Riverside Ave
- 638 Pontiac Ave
- 18 Glenwood Ave
- 26 Keith Ave
- 85 Alton St
- 124 Clarence St
- 65 Perkins Ave
- 36 Blackamore Ave
- 120 Gould Ave
- 110 Heath Ave
- 152 Woodbine St
- 70 Perkins Ave
- 105 Fordson Ave
- 113 Fordson Ave
- 35 Manson Ave
- 19 Piedmont St