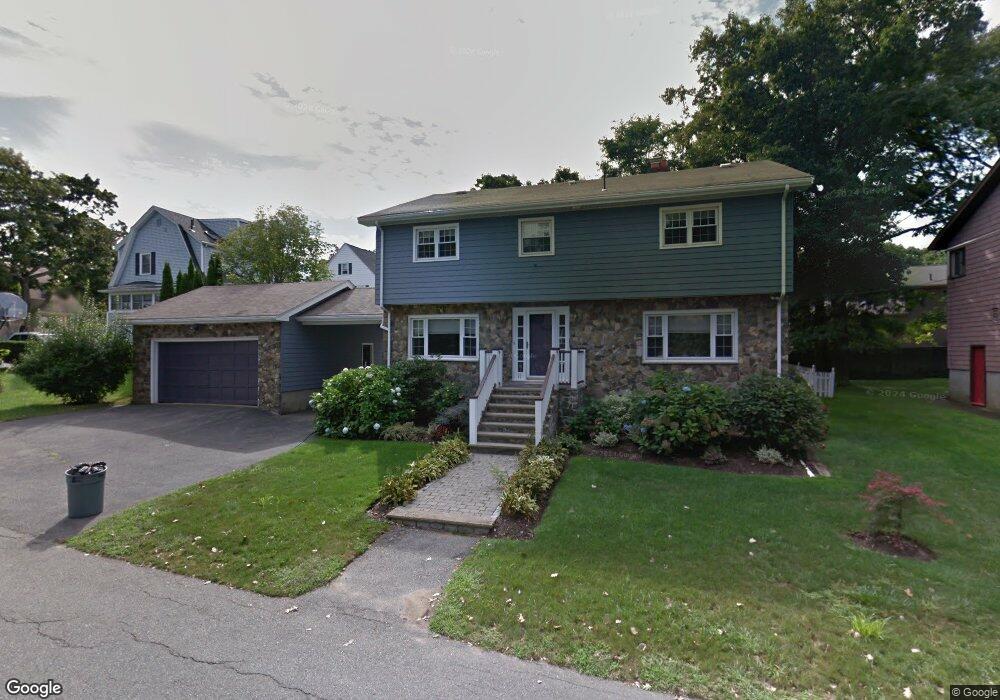
11 Millett Ln Swampscott, MA 01907
Estimated Value: $1,198,000 - $1,404,000
4
Beds
5
Baths
2,724
Sq Ft
$465/Sq Ft
Est. Value
About This Home
This home is located at 11 Millett Ln, Swampscott, MA 01907 and is currently estimated at $1,267,313, approximately $465 per square foot. 11 Millett Ln is a home located in Essex County with nearby schools including Swampscott Middle School and Swampscott High School.
Ownership History
Date
Name
Owned For
Owner Type
Purchase Details
Closed on
Oct 29, 2021
Sold by
Fafel Leonard and Fafel Steven
Bought by
Fafel Alyssa M and Fafel Steven
Current Estimated Value
Purchase Details
Closed on
Aug 23, 2011
Sold by
Fafel Leonard
Bought by
Fafel Leonard and Fafel Steven
Home Financials for this Owner
Home Financials are based on the most recent Mortgage that was taken out on this home.
Original Mortgage
$250,000
Interest Rate
4.6%
Purchase Details
Closed on
Jul 14, 2010
Sold by
Flynn John J and Flynn Kelly
Bought by
Fafel Leonard
Purchase Details
Closed on
Jan 28, 2008
Sold by
Gonzales Dana L and Gonzales Edward P
Bought by
Flynn John J
Purchase Details
Closed on
Jun 19, 2000
Sold by
Wharff John W and Wharff Lisa E
Bought by
Gonzales Edward P and Gonzales Dana L
Purchase Details
Closed on
May 31, 1995
Sold by
Sadur Joseph and Sadur Louise D
Bought by
Wharff John W and Wharff Lisa E
Create a Home Valuation Report for This Property
The Home Valuation Report is an in-depth analysis detailing your home's value as well as a comparison with similar homes in the area
Home Values in the Area
Average Home Value in this Area
Purchase History
| Date | Buyer | Sale Price | Title Company |
|---|---|---|---|
| Fafel Alyssa M | -- | None Available | |
| Fafel Leonard | -- | -- | |
| Fafel Leonard | $572,500 | -- | |
| Flynn John J | $583,500 | -- | |
| Gonzales Edward P | $510,200 | -- | |
| Wharff John W | $278,500 | -- |
Source: Public Records
Mortgage History
| Date | Status | Borrower | Loan Amount |
|---|---|---|---|
| Previous Owner | Wharff John W | $390,000 | |
| Previous Owner | Wharff John W | $250,000 |
Source: Public Records
Tax History Compared to Growth
Tax History
| Year | Tax Paid | Tax Assessment Tax Assessment Total Assessment is a certain percentage of the fair market value that is determined by local assessors to be the total taxable value of land and additions on the property. | Land | Improvement |
|---|---|---|---|---|
| 2025 | $11,713 | $1,021,200 | $386,800 | $634,400 |
| 2024 | $11,425 | $994,300 | $367,900 | $626,400 |
| 2023 | $10,660 | $908,000 | $330,200 | $577,800 |
| 2022 | $10,489 | $817,500 | $283,000 | $534,500 |
| 2021 | $10,317 | $747,600 | $264,100 | $483,500 |
| 2020 | $10,170 | $711,200 | $235,800 | $475,400 |
| 2019 | $10,453 | $687,700 | $212,300 | $475,400 |
| 2018 | $10,387 | $649,200 | $193,400 | $455,800 |
| 2017 | $10,688 | $612,500 | $181,100 | $431,400 |
| 2016 | $10,615 | $612,500 | $181,100 | $431,400 |
| 2015 | $10,504 | $612,500 | $181,100 | $431,400 |
| 2014 | $10,154 | $543,000 | $150,900 | $392,100 |
Source: Public Records
Map
Nearby Homes
- 8 Ocean View Rd
- 75 Bay View Dr
- 21 Bay View Dr
- 13 Cedar Hill Terrace Unit 2
- 71 Greenwood Ave Unit 207
- 71 Walnut Rd
- 140 Elmwood Rd
- 309 Paradise Rd
- 35 Alden Rd
- 306 Paradise Rd
- 24 Orchard Cir
- 98 Paradise Rd
- 110 Galloupes Point Rd
- 5 Summit View Dr
- 51 Barnstable St
- 28 Claremont Terrace Unit 4
- 28 Claremont Terrace Unit 6
- 30 Paradise Rd
- 108-110 Burrill St Unit 1
- 106 Norfolk Ave