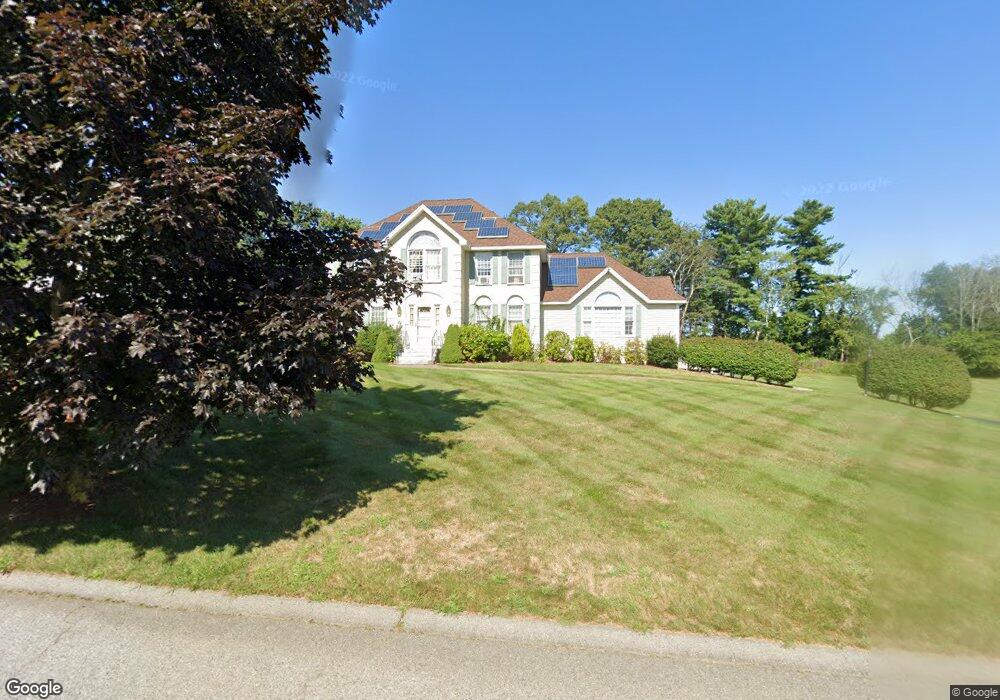
11 Morgan Dr Methuen, MA 01844
The North End NeighborhoodEstimated Value: $812,000 - $967,000
5
Beds
4
Baths
3,158
Sq Ft
$282/Sq Ft
Est. Value
About This Home
This home is located at 11 Morgan Dr, Methuen, MA 01844 and is currently estimated at $890,204, approximately $281 per square foot. 11 Morgan Dr is a home located in Essex County with nearby schools including Methuen High School, St. Joseph Regional Catholic School, and Hilltop School.
Ownership History
Date
Name
Owned For
Owner Type
Purchase Details
Closed on
Sep 28, 2023
Sold by
Patel Thakor B and Patel Mina T
Bought by
Patel Mina T and Patel Thakor B
Current Estimated Value
Purchase Details
Closed on
Dec 16, 1996
Sold by
Hampstead Dev Inc
Bought by
Patel Thakor B
Home Financials for this Owner
Home Financials are based on the most recent Mortgage that was taken out on this home.
Original Mortgage
$50,100
Interest Rate
7.5%
Create a Home Valuation Report for This Property
The Home Valuation Report is an in-depth analysis detailing your home's value as well as a comparison with similar homes in the area
Home Values in the Area
Average Home Value in this Area
Purchase History
| Date | Buyer | Sale Price | Title Company |
|---|---|---|---|
| Patel Mina T | -- | None Available | |
| Patel Thakor B | $317,250 | -- |
Source: Public Records
Mortgage History
| Date | Status | Borrower | Loan Amount |
|---|---|---|---|
| Previous Owner | Patel Thakor B | $62,829 | |
| Previous Owner | Patel Thakor B | $272,000 | |
| Previous Owner | Patel Thakor B | $50,100 |
Source: Public Records
Tax History
| Year | Tax Paid | Tax Assessment Tax Assessment Total Assessment is a certain percentage of the fair market value that is determined by local assessors to be the total taxable value of land and additions on the property. | Land | Improvement |
|---|---|---|---|---|
| 2025 | $8,624 | $815,100 | $310,300 | $504,800 |
| 2024 | $8,510 | $783,600 | $273,100 | $510,500 |
| 2023 | $7,861 | $671,900 | $241,700 | $430,200 |
| 2022 | $7,936 | $608,100 | $221,000 | $387,100 |
| 2021 | $7,469 | $566,300 | $210,600 | $355,700 |
| 2020 | $7,400 | $550,600 | $210,600 | $340,000 |
| 2019 | $7,329 | $516,500 | $200,300 | $316,200 |
| 2018 | $7,136 | $500,100 | $200,300 | $299,800 |
| 2017 | $6,929 | $473,000 | $200,300 | $272,700 |
| 2016 | $6,925 | $467,600 | $200,300 | $267,300 |
| 2015 | $6,668 | $456,700 | $200,300 | $256,400 |
Source: Public Records
Map
Nearby Homes
- 139 North St
- 40 Stanwood Rd Unit 9
- 74 Ayers Village Rd
- 1513 Broadway
- 384 Main St Unit 203
- 384 Main St Unit 102
- 11 Brookside Ct
- 9 Falcon Ln
- 47 Bailey Ct
- 9 Clydesdale Rd
- 20 Williams St
- 17 Canterbury Ct
- 5 Highland Ave
- 5 Sally Sweets Way Unit 110
- 5 Sally Sweets Way Unit 128
- 117 Lawrence Rd
- 29 Emma Rose Cir Unit Lot 22
- 27 Emma Rose Cir Unit Lot 23
- 26 Emma Rose Cir Unit Lot 1
- 28 Emma Rose Cir Unit Lot 2
Your Personal Tour Guide
Ask me questions while you tour the home.