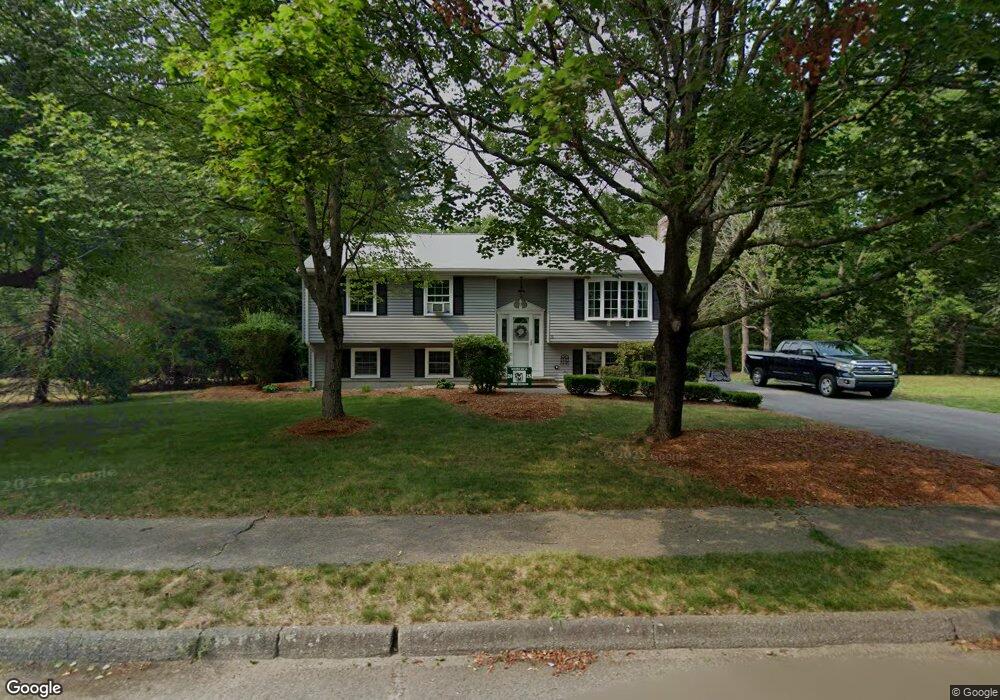
11 Morgan Rd Mansfield, MA 02048
Estimated Value: $637,821 - $706,000
3
Beds
1
Bath
1,132
Sq Ft
$593/Sq Ft
Est. Value
About This Home
This home is located at 11 Morgan Rd, Mansfield, MA 02048 and is currently estimated at $671,455, approximately $593 per square foot. 11 Morgan Rd is a home located in Bristol County with nearby schools including Everett W. Robinson Elementary School, Jordan/Jackson Elementary School, and Harold L. Qualters Middle School.
Ownership History
Date
Name
Owned For
Owner Type
Purchase Details
Closed on
Oct 25, 2001
Sold by
Puleo John A and Puleo Karen F
Bought by
Cannon James C and Cannon Kelly
Current Estimated Value
Home Financials for this Owner
Home Financials are based on the most recent Mortgage that was taken out on this home.
Original Mortgage
$216,000
Interest Rate
6.86%
Mortgage Type
Purchase Money Mortgage
Create a Home Valuation Report for This Property
The Home Valuation Report is an in-depth analysis detailing your home's value as well as a comparison with similar homes in the area
Home Values in the Area
Average Home Value in this Area
Purchase History
| Date | Buyer | Sale Price | Title Company |
|---|---|---|---|
| Cannon James C | $270,000 | -- |
Source: Public Records
Mortgage History
| Date | Status | Borrower | Loan Amount |
|---|---|---|---|
| Open | Cannon James C | $195,000 | |
| Closed | Cannon James C | $216,000 | |
| Previous Owner | Cannon James C | $62,000 |
Source: Public Records
Tax History Compared to Growth
Tax History
| Year | Tax Paid | Tax Assessment Tax Assessment Total Assessment is a certain percentage of the fair market value that is determined by local assessors to be the total taxable value of land and additions on the property. | Land | Improvement |
|---|---|---|---|---|
| 2025 | $7,109 | $539,800 | $282,200 | $257,600 |
| 2024 | $6,673 | $494,300 | $269,500 | $224,800 |
| 2023 | $6,560 | $465,600 | $269,500 | $196,100 |
| 2022 | $6,374 | $420,200 | $249,800 | $170,400 |
| 2021 | $6,227 | $405,400 | $237,400 | $168,000 |
| 2020 | $5,844 | $380,500 | $208,100 | $172,400 |
| 2019 | $5,641 | $370,600 | $198,200 | $172,400 |
| 2018 | $5,425 | $348,400 | $189,300 | $159,100 |
| 2017 | $5,200 | $346,200 | $184,100 | $162,100 |
| 2016 | $5,130 | $332,900 | $175,200 | $157,700 |
| 2015 | $4,817 | $310,800 | $175,200 | $135,600 |
Source: Public Records
Map
Nearby Homes
- 24 Maverick Dr
- 4 Buckskin Dr
- 150 Gilbert St
- 116 George St
- 406 South St
- 16 Treasure Island Rd
- 11 Landry Ave
- 196 Donald Tennant Cir
- 255 Mckeon Dr
- 5 Old Wood Rd
- 9 Oak Dr
- 15 Old Wood Rd
- 28 Messenger St
- 57 Vine St
- 115 Westfield Dr
- 450 West St
- 9 Sunnyside Dr Unit 9
- Lot 5 Jeffrey Dr
- 176 Elm St
- 11 Buckthorn Ln