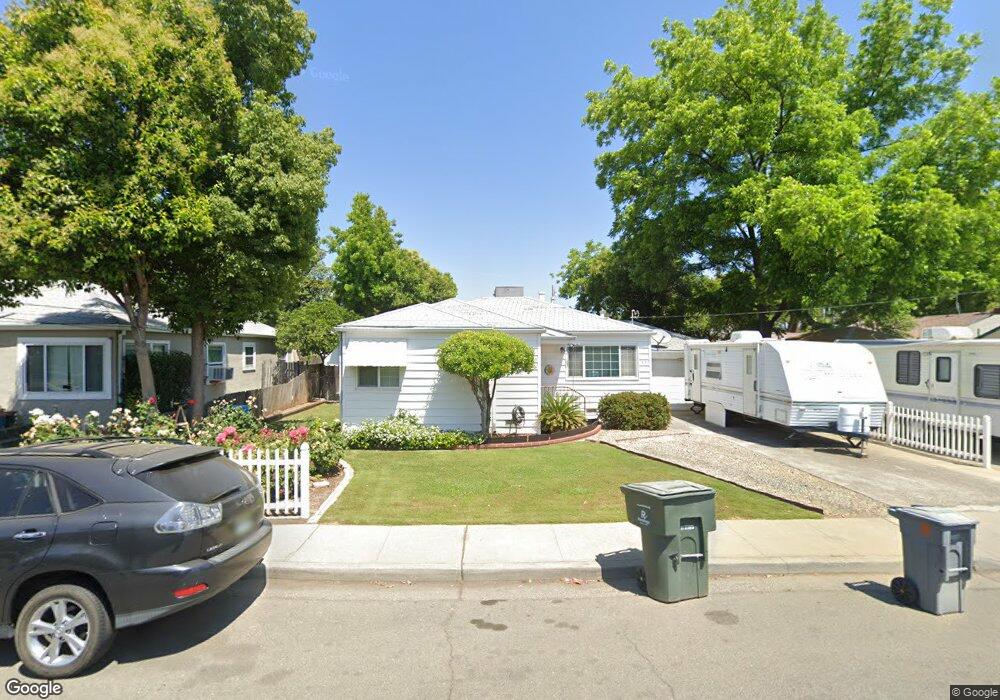
11 Morton St Yuba City, CA 95991
Estimated Value: $276,000 - $291,000
2
Beds
1
Bath
892
Sq Ft
$320/Sq Ft
Est. Value
About This Home
This home is located at 11 Morton St, Yuba City, CA 95991 and is currently estimated at $285,546, approximately $320 per square foot. 11 Morton St is a home located in Sutter County with nearby schools including Park Avenue Elementary School, Gray Avenue Middle School, and Yuba City High School.
Ownership History
Date
Name
Owned For
Owner Type
Purchase Details
Closed on
Dec 18, 2007
Sold by
Bays Pauline M
Bought by
Long Ryan D and Long Sally A
Current Estimated Value
Home Financials for this Owner
Home Financials are based on the most recent Mortgage that was taken out on this home.
Original Mortgage
$183,000
Outstanding Balance
$149,362
Interest Rate
6.2%
Mortgage Type
Purchase Money Mortgage
Estimated Equity
$136,184
Purchase Details
Closed on
Dec 13, 2001
Sold by
Olson Leland W and Olson Dorothy E
Bought by
Bays Pauline M
Home Financials for this Owner
Home Financials are based on the most recent Mortgage that was taken out on this home.
Original Mortgage
$92,150
Interest Rate
6.39%
Create a Home Valuation Report for This Property
The Home Valuation Report is an in-depth analysis detailing your home's value as well as a comparison with similar homes in the area
Home Values in the Area
Average Home Value in this Area
Purchase History
| Date | Buyer | Sale Price | Title Company |
|---|---|---|---|
| Long Ryan D | $183,000 | Placer Title Company | |
| Bays Pauline M | $97,000 | North State Title Company |
Source: Public Records
Mortgage History
| Date | Status | Borrower | Loan Amount |
|---|---|---|---|
| Open | Long Ryan D | $183,000 | |
| Previous Owner | Bays Pauline M | $92,150 |
Source: Public Records
Tax History Compared to Growth
Tax History
| Year | Tax Paid | Tax Assessment Tax Assessment Total Assessment is a certain percentage of the fair market value that is determined by local assessors to be the total taxable value of land and additions on the property. | Land | Improvement |
|---|---|---|---|---|
| 2025 | $2,605 | $240,356 | $78,802 | $161,554 |
| 2024 | $2,605 | $235,644 | $77,257 | $158,387 |
| 2023 | $2,605 | $231,025 | $75,743 | $155,282 |
| 2022 | $2,052 | $185,000 | $100,000 | $85,000 |
| 2021 | $1,900 | $170,000 | $95,000 | $75,000 |
| 2020 | $1,719 | $155,000 | $65,000 | $90,000 |
| 2019 | $1,658 | $150,000 | $50,000 | $100,000 |
| 2018 | $1,643 | $148,000 | $40,000 | $108,000 |
| 2017 | $1,225 | $111,100 | $38,500 | $72,600 |
| 2016 | $1,111 | $101,000 | $35,000 | $66,000 |
| 2015 | $1,026 | $93,450 | $31,500 | $61,950 |
| 2014 | $984 | $89,000 | $30,000 | $59,000 |
Source: Public Records
Map
Nearby Homes