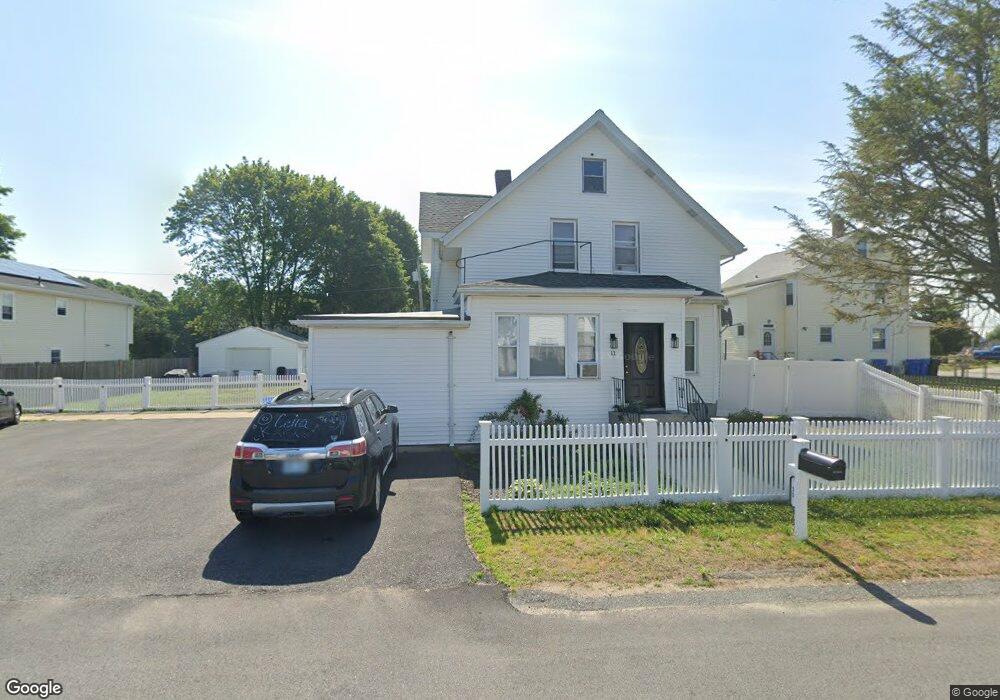
11 Myrtle St Cumberland, RI 02864
Valley Falls NeighborhoodEstimated Value: $392,688 - $519,000
4
Beds
2
Baths
1,804
Sq Ft
$258/Sq Ft
Est. Value
About This Home
This home is located at 11 Myrtle St, Cumberland, RI 02864 and is currently estimated at $465,922, approximately $258 per square foot. 11 Myrtle St is a home located in Providence County with nearby schools including B.F. Norton Elementary School, Joseph L. McCourt Middle School, and Cumberland High School.
Ownership History
Date
Name
Owned For
Owner Type
Purchase Details
Closed on
Aug 8, 2000
Sold by
Kabbabe Salim M
Bought by
Rodrigues Orisa B
Current Estimated Value
Purchase Details
Closed on
Jul 31, 1989
Sold by
Marquez Jose N
Bought by
Cabbabe Gilbert M
Create a Home Valuation Report for This Property
The Home Valuation Report is an in-depth analysis detailing your home's value as well as a comparison with similar homes in the area
Home Values in the Area
Average Home Value in this Area
Purchase History
| Date | Buyer | Sale Price | Title Company |
|---|---|---|---|
| Rodrigues Orisa B | $123,500 | -- | |
| Cabbabe Gilbert M | $138,000 | -- |
Source: Public Records
Mortgage History
| Date | Status | Borrower | Loan Amount |
|---|---|---|---|
| Open | Cabbabe Gilbert M | $31,500 | |
| Open | Cabbabe Gilbert M | $252,000 | |
| Closed | Cabbabe Gilbert M | $31,500 |
Source: Public Records
Tax History Compared to Growth
Tax History
| Year | Tax Paid | Tax Assessment Tax Assessment Total Assessment is a certain percentage of the fair market value that is determined by local assessors to be the total taxable value of land and additions on the property. | Land | Improvement |
|---|---|---|---|---|
| 2025 | $4,115 | $335,400 | $102,700 | $232,700 |
| 2024 | $4,008 | $335,400 | $102,700 | $232,700 |
| 2023 | $3,892 | $334,900 | $102,700 | $232,200 |
| 2022 | $3,028 | $202,000 | $75,300 | $126,700 |
| 2021 | $2,977 | $202,000 | $75,300 | $126,700 |
| 2020 | $2,893 | $202,000 | $75,300 | $126,700 |
| 2019 | $2,901 | $182,700 | $65,000 | $117,700 |
| 2018 | $2,817 | $182,700 | $65,000 | $117,700 |
| 2017 | $2,779 | $182,700 | $65,000 | $117,700 |
| 2016 | $2,799 | $163,900 | $69,100 | $94,800 |
| 2015 | $2,799 | $163,900 | $69,100 | $94,800 |
| 2014 | $14,869 | $163,900 | $69,100 | $94,800 |
| 2013 | $2,621 | $166,100 | $69,100 | $97,000 |
Source: Public Records
Map
Nearby Homes
- 0 Prospect St Unit 2
- 0 Prospect St Unit 1
- 0 Prospect St
- 63 Carpenter St
- 51 Lawn St
- 106 Pond St Unit U 31
- 0 New Haven St
- 1270 Broad St
- 55 Leedham St Unit 2-6
- 513 Mendon Rd Unit 513
- 515 Mendon Rd Unit 515
- 91 Greenwich St
- 511 Mendon Rd Unit 511
- 509 Mendon Rd Unit 509
- 3 Robin Hood Ln Unit 179
- 6 Castle Rd
- 16 Ingraham St
- 330 Brown St
- 1 Allenson Ave
- 27 Collins Ave