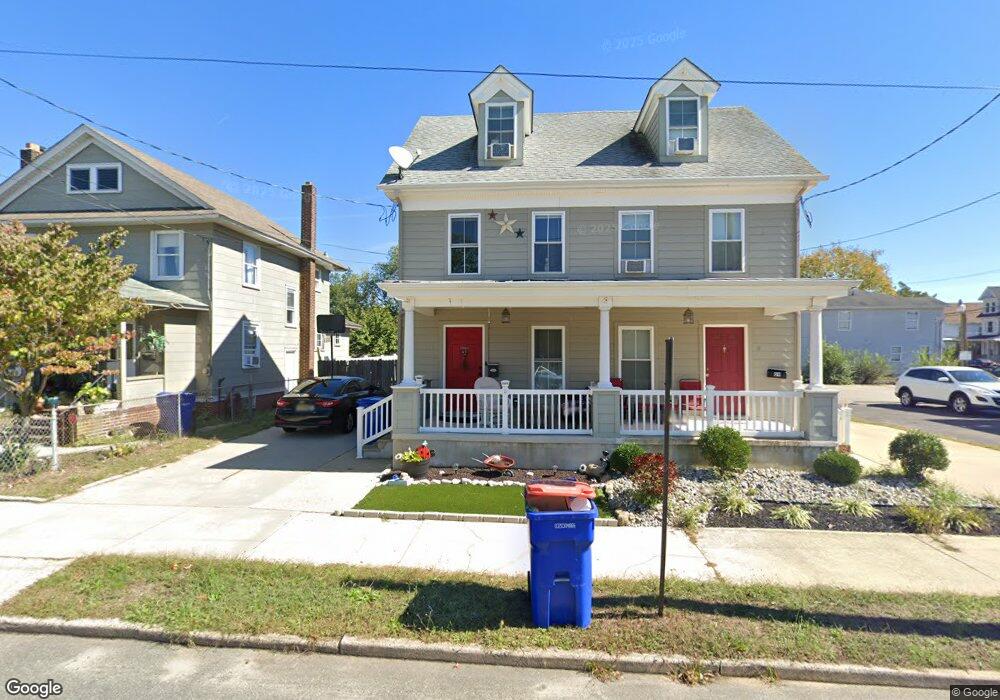
11 N 4th St Millville, NJ 08332
Estimated Value: $128,766 - $165,000
--
Bed
--
Bath
1,110
Sq Ft
$130/Sq Ft
Est. Value
About This Home
This home is located at 11 N 4th St, Millville, NJ 08332 and is currently estimated at $143,942, approximately $129 per square foot. 11 N 4th St is a home located in Cumberland County with nearby schools including Silver Run Elementary School, Lakeside Middle School, and Memorial High School.
Ownership History
Date
Name
Owned For
Owner Type
Purchase Details
Closed on
Apr 29, 2011
Sold by
Affordable Homes Of Millville Ecumenic
Bought by
Andrews Justin A and Andrews Jennifer A
Current Estimated Value
Home Financials for this Owner
Home Financials are based on the most recent Mortgage that was taken out on this home.
Original Mortgage
$82,450
Outstanding Balance
$57,299
Interest Rate
4.88%
Mortgage Type
Purchase Money Mortgage
Estimated Equity
$86,643
Create a Home Valuation Report for This Property
The Home Valuation Report is an in-depth analysis detailing your home's value as well as a comparison with similar homes in the area
Home Values in the Area
Average Home Value in this Area
Purchase History
| Date | Buyer | Sale Price | Title Company |
|---|---|---|---|
| Andrews Justin A | $85,000 | -- |
Source: Public Records
Mortgage History
| Date | Status | Borrower | Loan Amount |
|---|---|---|---|
| Open | Andrews Justin A | $82,450 |
Source: Public Records
Tax History Compared to Growth
Tax History
| Year | Tax Paid | Tax Assessment Tax Assessment Total Assessment is a certain percentage of the fair market value that is determined by local assessors to be the total taxable value of land and additions on the property. | Land | Improvement |
|---|---|---|---|---|
| 2025 | $2,536 | $64,600 | $14,400 | $50,200 |
| 2024 | $2,536 | $64,600 | $14,400 | $50,200 |
| 2023 | $2,514 | $64,600 | $14,400 | $50,200 |
| 2022 | $2,449 | $64,600 | $14,400 | $50,200 |
| 2021 | $2,370 | $64,600 | $14,400 | $50,200 |
| 2020 | $2,330 | $64,600 | $14,400 | $50,200 |
| 2019 | $2,222 | $64,600 | $14,400 | $50,200 |
| 2018 | $2,176 | $64,600 | $14,400 | $50,200 |
| 2017 | $2,156 | $64,600 | $14,400 | $50,200 |
| 2016 | $2,129 | $64,600 | $14,400 | $50,200 |
| 2015 | $2,081 | $64,600 | $14,400 | $50,200 |
| 2014 | $2,085 | $64,600 | $14,400 | $50,200 |
Source: Public Records
Map
Nearby Homes