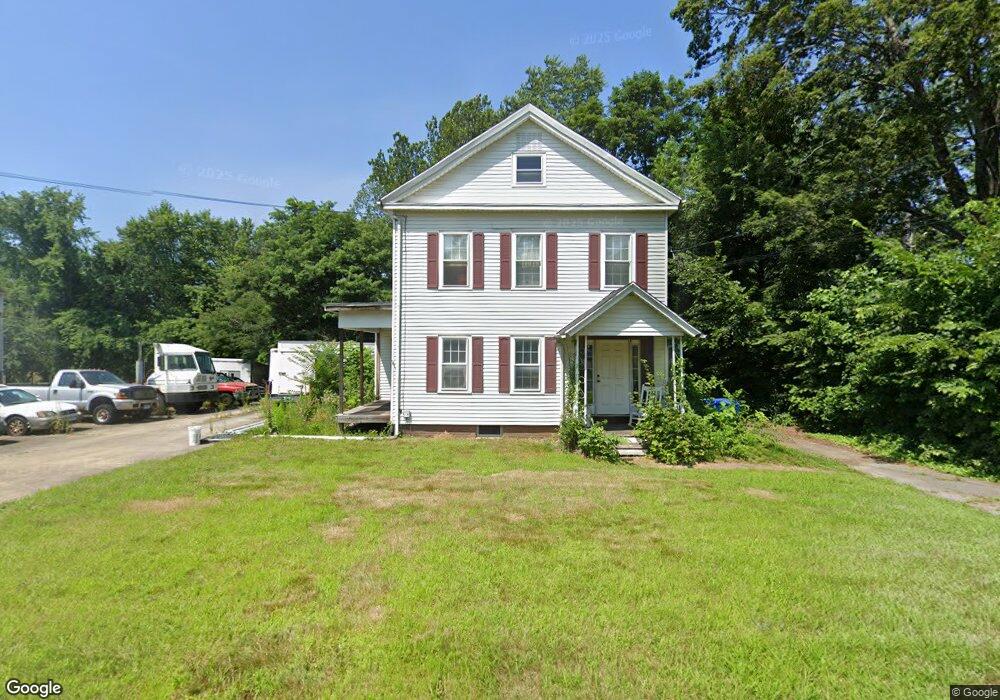
11 N Main St East Windsor, CT 06088
Estimated Value: $336,000 - $357,000
4
Beds
2
Baths
2,197
Sq Ft
$158/Sq Ft
Est. Value
About This Home
This home is located at 11 N Main St, East Windsor, CT 06088 and is currently estimated at $346,225, approximately $157 per square foot. 11 N Main St is a home located in Hartford County with nearby schools including Broad Brook Elementary School, East Windsor Middle School, and East Windsor High School.
Ownership History
Date
Name
Owned For
Owner Type
Purchase Details
Closed on
Aug 17, 2000
Sold by
Kirk Marjorie
Bought by
Starvish Peter and Starvish Susan
Current Estimated Value
Home Financials for this Owner
Home Financials are based on the most recent Mortgage that was taken out on this home.
Original Mortgage
$112,500
Interest Rate
11.01%
Create a Home Valuation Report for This Property
The Home Valuation Report is an in-depth analysis detailing your home's value as well as a comparison with similar homes in the area
Home Values in the Area
Average Home Value in this Area
Purchase History
| Date | Buyer | Sale Price | Title Company |
|---|---|---|---|
| Starvish Peter | $125,000 | -- |
Source: Public Records
Mortgage History
| Date | Status | Borrower | Loan Amount |
|---|---|---|---|
| Open | Starvish Peter | $146,070 | |
| Closed | Starvish Peter | $169,099 | |
| Closed | Starvish Peter | $112,500 | |
| Previous Owner | Starvish Peter | $41,000 |
Source: Public Records
Tax History Compared to Growth
Tax History
| Year | Tax Paid | Tax Assessment Tax Assessment Total Assessment is a certain percentage of the fair market value that is determined by local assessors to be the total taxable value of land and additions on the property. | Land | Improvement |
|---|---|---|---|---|
| 2025 | $4,738 | $175,270 | $27,220 | $148,050 |
| 2024 | $4,585 | $175,270 | $27,220 | $148,050 |
| 2023 | $3,386 | $92,560 | $40,750 | $51,810 |
| 2022 | $3,513 | $92,560 | $40,750 | $51,810 |
| 2021 | $3,369 | $92,560 | $40,750 | $51,810 |
| 2020 | $3,371 | $92,560 | $40,750 | $51,810 |
| 2019 | $3,300 | $92,560 | $40,750 | $51,810 |
| 2018 | $3,267 | $92,560 | $40,750 | $51,810 |
| 2017 | $3,579 | $105,040 | $38,450 | $66,590 |
| 2016 | $3,375 | $105,040 | $38,450 | $66,590 |
| 2015 | $3,184 | $105,040 | $38,450 | $66,590 |
| 2014 | $3,128 | $105,040 | $38,450 | $66,590 |
Source: Public Records
Map
Nearby Homes
- 0 N Water St Unit 24138494
- 0 N Water St Unit 24128295
- 0 N Water St Unit 24128294
- 0 N Water St Unit 24128288
- 0 N Water St
- 143 Bridge St
- 32 Pleasant Rd
- 22 Chestnut St Unit 24
- 14 Seymour Rd
- 15 Suffield St
- 66 Center St
- 22 Pearl St
- 59 Elm St
- 15 Pearl St
- 114 Elm St
- 15 Dickerman Ave
- 32 School St
- 21 King Ct
- 106 Orchard Hill Dr
- 0 Mullen Rd