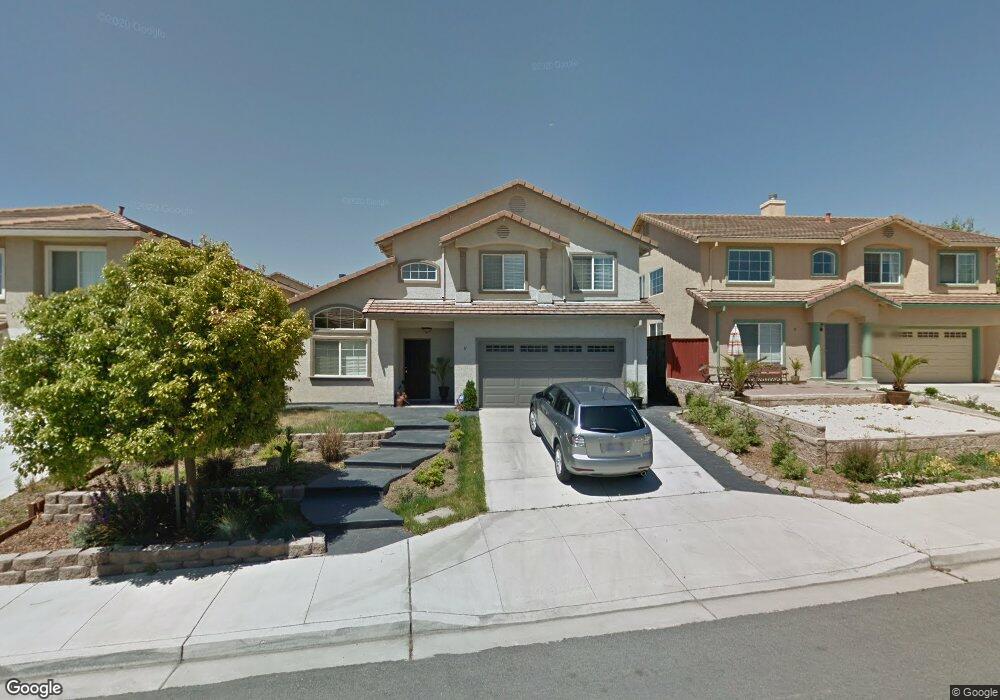
11 New Hampshire Cir Salinas, CA 93905
Creekbridge NeighborhoodEstimated Value: $780,315 - $861,000
4
Beds
3
Baths
2,105
Sq Ft
$395/Sq Ft
Est. Value
About This Home
This home is located at 11 New Hampshire Cir, Salinas, CA 93905 and is currently estimated at $831,079, approximately $394 per square foot. 11 New Hampshire Cir is a home located in Monterey County with nearby schools including Creekside Elementary School, Harden Middle School, and Alisal High School.
Ownership History
Date
Name
Owned For
Owner Type
Purchase Details
Closed on
Sep 5, 2013
Sold by
Kostyal Teima Oliveira
Bought by
Kostyai Jonathan Scott
Current Estimated Value
Purchase Details
Closed on
May 4, 2010
Sold by
Kondaur Capital Corporation
Bought by
Kostyal Jonathan S and Kostyal Telma O
Home Financials for this Owner
Home Financials are based on the most recent Mortgage that was taken out on this home.
Original Mortgage
$244,000
Outstanding Balance
$163,463
Interest Rate
5.04%
Mortgage Type
New Conventional
Estimated Equity
$667,616
Purchase Details
Closed on
Feb 19, 2010
Sold by
Garcia Robert R and Garcia Marisol V
Bought by
Kondaur Capital Corporation
Purchase Details
Closed on
Oct 28, 2002
Sold by
First American Title Company
Bought by
Garcia Robert R and Garcia Marisol V
Home Financials for this Owner
Home Financials are based on the most recent Mortgage that was taken out on this home.
Original Mortgage
$292,000
Interest Rate
7%
Create a Home Valuation Report for This Property
The Home Valuation Report is an in-depth analysis detailing your home's value as well as a comparison with similar homes in the area
Home Values in the Area
Average Home Value in this Area
Purchase History
| Date | Buyer | Sale Price | Title Company |
|---|---|---|---|
| Kostyai Jonathan Scott | -- | None Available | |
| Kostyal Jonathan S | $305,000 | First American Title Company | |
| Kondaur Capital Corporation | $250,000 | Accommodation | |
| Garcia Robert R | $365,000 | First American Title |
Source: Public Records
Mortgage History
| Date | Status | Borrower | Loan Amount |
|---|---|---|---|
| Open | Kostyal Jonathan S | $244,000 | |
| Previous Owner | Garcia Robert R | $292,000 |
Source: Public Records
Tax History Compared to Growth
Tax History
| Year | Tax Paid | Tax Assessment Tax Assessment Total Assessment is a certain percentage of the fair market value that is determined by local assessors to be the total taxable value of land and additions on the property. | Land | Improvement |
|---|---|---|---|---|
| 2025 | $5,291 | $393,686 | $83,895 | $309,791 |
| 2024 | $5,291 | $385,967 | $82,250 | $303,717 |
| 2023 | $5,221 | $378,400 | $80,638 | $297,762 |
| 2022 | $4,709 | $370,981 | $79,057 | $291,924 |
| 2021 | $4,708 | $363,707 | $77,507 | $286,200 |
| 2020 | $4,654 | $359,979 | $76,713 | $283,266 |
| 2019 | $4,797 | $352,921 | $75,209 | $277,712 |
| 2018 | $4,527 | $346,002 | $73,735 | $272,267 |
| 2017 | $4,692 | $339,219 | $72,290 | $266,929 |
| 2016 | $4,454 | $332,569 | $70,873 | $261,696 |
| 2015 | $4,413 | $327,575 | $69,809 | $257,766 |
| 2014 | $4,255 | $321,159 | $68,442 | $252,717 |
Source: Public Records
Map
Nearby Homes
- 1392 New Hampshire Ct
- 7 Massachusetts Cir
- 8 Bristol Cir
- 1920 Constitution Blvd Unit 36
- 1204 Pickford Way
- 1454 Madrone Dr
- 831 Cactus Ct
- 1 Eliot Cir
- 852 Antigua Ave
- 18 Suffield Cir
- 1049 Twin Creeks Dr
- 742 Pino Way
- 1615 Newport Ct
- 811 Kilbreth Ave
- 1513 Oyster Bay Ct
- 822 Castleton St
- 794 Danbury St
- 704 Garner Ave Unit 3
- 948 Rider Ave
- 734 Los Coches Ave
- 7 New Hampshire Cir
- 15 New Hampshire Cir
- 1327 New Hampshire Ct
- 1331 New Hampshire Ct
- 19 New Hampshire Cir
- 3 New Hampshire Cir
- 1323 New Hampshire Ct
- 1335 New Hampshire Ct
- 12 New Hampshire Cir
- 16 New Hampshire Cir
- 8 New Hampshire Cir
- 8 New Hampshire Cir
- 20 New Hampshire Cir
- 23 New Hampshire Cir
- 1319 New Hampshire Ct
- 0 New Hampshire Cir Unit ML574333
- 0 New Hampshire Cir Unit ML569520
- 4 New Hampshire Cir
- 24 New Hampshire Cir
- 1315 New Hampshire Ct