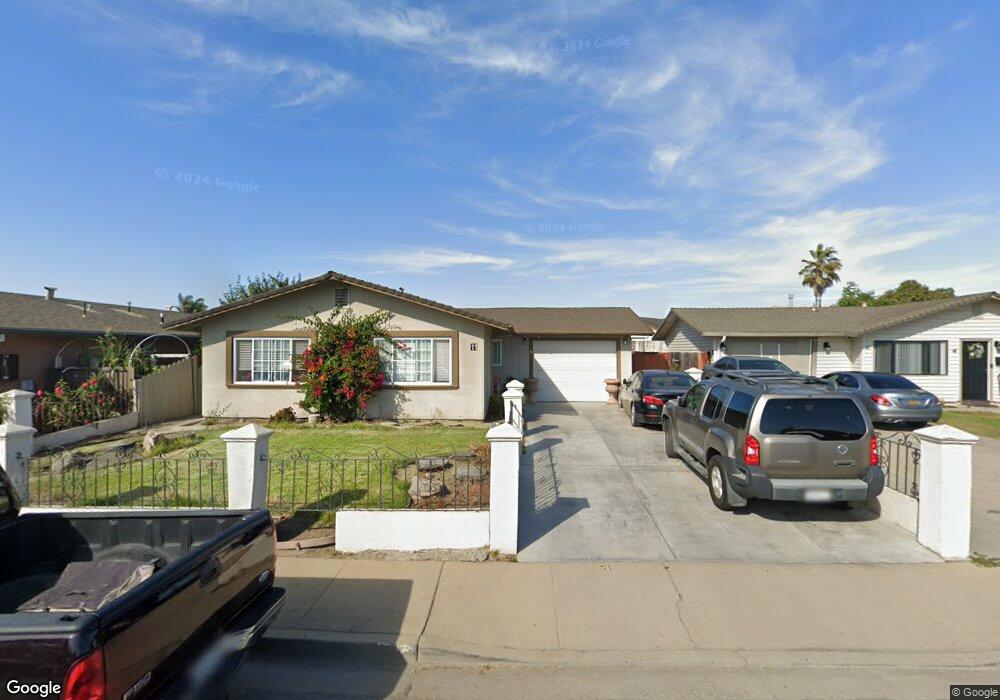
11 Nogal Cir Salinas, CA 93905
East Salinas NeighborhoodEstimated Value: $526,369 - $593,000
3
Beds
1
Bath
1,029
Sq Ft
$555/Sq Ft
Est. Value
About This Home
This home is located at 11 Nogal Cir, Salinas, CA 93905 and is currently estimated at $571,092, approximately $554 per square foot. 11 Nogal Cir is a home located in Monterey County with nearby schools including Virginia Rocca Barton Elementary School, La Paz Middle School, and Alisal High School.
Ownership History
Date
Name
Owned For
Owner Type
Purchase Details
Closed on
Mar 21, 2023
Sold by
Mojica Raquel
Bought by
Mojica Raquel and Vasquez Anthony
Current Estimated Value
Purchase Details
Closed on
Jul 16, 2020
Sold by
Mojica Raquel Fuerte
Bought by
Mojica Raquel Fuerte
Home Financials for this Owner
Home Financials are based on the most recent Mortgage that was taken out on this home.
Original Mortgage
$156,000
Interest Rate
3.1%
Mortgage Type
New Conventional
Purchase Details
Closed on
Feb 27, 1996
Sold by
Mojica Juan and Mojica Gabina
Bought by
Mojica Juan and Mojica Gabina
Home Financials for this Owner
Home Financials are based on the most recent Mortgage that was taken out on this home.
Original Mortgage
$52,000
Interest Rate
7.04%
Create a Home Valuation Report for This Property
The Home Valuation Report is an in-depth analysis detailing your home's value as well as a comparison with similar homes in the area
Home Values in the Area
Average Home Value in this Area
Purchase History
| Date | Buyer | Sale Price | Title Company |
|---|---|---|---|
| Mojica Raquel | -- | None Listed On Document | |
| Mojica Raquel Fuerte | -- | Chicago Title Company | |
| Mojica Juan | -- | Chicago Title Co |
Source: Public Records
Mortgage History
| Date | Status | Borrower | Loan Amount |
|---|---|---|---|
| Previous Owner | Mojica Raquel Fuerte | $156,000 | |
| Previous Owner | Mojica Juan | $52,000 |
Source: Public Records
Tax History Compared to Growth
Tax History
| Year | Tax Paid | Tax Assessment Tax Assessment Total Assessment is a certain percentage of the fair market value that is determined by local assessors to be the total taxable value of land and additions on the property. | Land | Improvement |
|---|---|---|---|---|
| 2025 | $1,812 | $135,221 | $52,819 | $82,402 |
| 2024 | $1,812 | $132,571 | $51,784 | $80,787 |
| 2023 | $1,779 | $129,972 | $50,769 | $79,203 |
| 2022 | $1,602 | $127,424 | $49,774 | $77,650 |
| 2021 | $1,602 | $124,927 | $48,799 | $76,128 |
| 2020 | $1,585 | $123,647 | $48,299 | $75,348 |
| 2019 | $1,632 | $121,223 | $47,352 | $73,871 |
| 2018 | $1,538 | $118,847 | $46,424 | $72,423 |
| 2017 | $1,596 | $116,517 | $45,514 | $71,003 |
| 2016 | $1,515 | $114,233 | $44,622 | $69,611 |
| 2015 | $1,501 | $112,518 | $43,952 | $68,566 |
| 2014 | $1,449 | $110,315 | $43,092 | $67,223 |
Source: Public Records
Map
Nearby Homes
- 742 Pino Way
- 852 Antigua Ave
- 1049 Twin Creeks Dr
- 1454 Madrone Dr
- 811 Kilbreth Ave
- 7 Massachusetts Cir
- 704 Garner Ave Unit 3
- 8 Bristol Cir
- 948 Rider Ave
- 18 Suffield Cir
- 1392 New Hampshire Ct
- 709 Gee St
- 1920 Constitution Blvd Unit 36
- 1615 Newport Ct
- 831 Cactus Ct
- 1513 Oyster Bay Ct
- 914 Acosta Plaza Unit 91
- 914 Acosta Plaza Unit 111
- 914 Acosta Plaza Unit 94
- 917 Acosta Plaza Unit 4