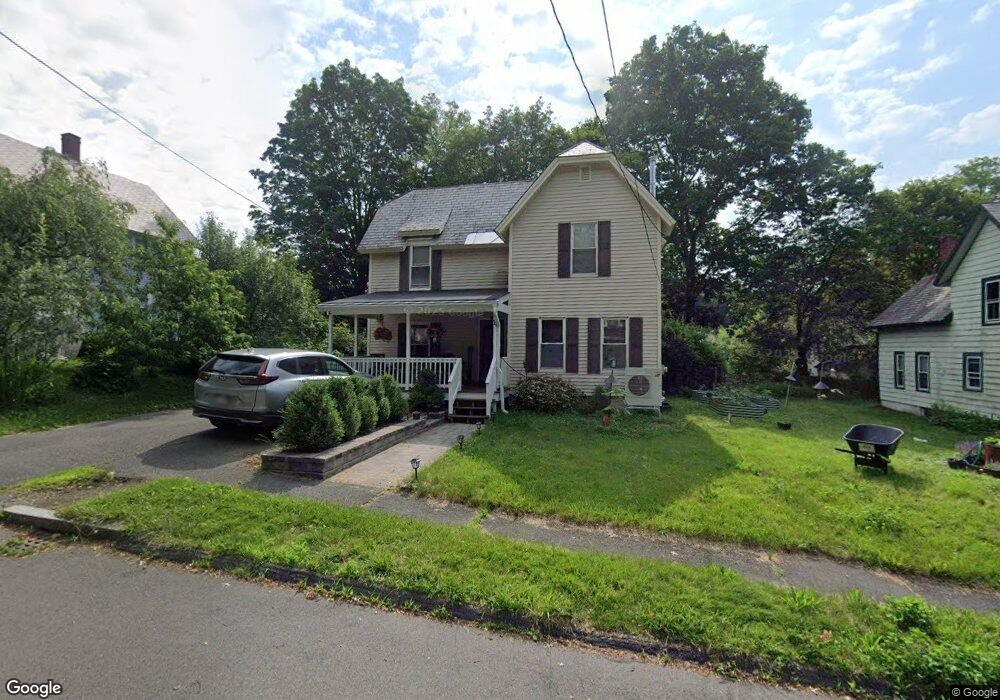
11 Oak St Greenfield, MA 01301
Estimated Value: $279,000 - $325,000
3
Beds
3
Baths
1,350
Sq Ft
$227/Sq Ft
Est. Value
About This Home
This home is located at 11 Oak St, Greenfield, MA 01301 and is currently estimated at $306,882, approximately $227 per square foot. 11 Oak St is a home located in Franklin County with nearby schools including Holy Trinity School and Cornerstone Christian School.
Ownership History
Date
Name
Owned For
Owner Type
Purchase Details
Closed on
Nov 5, 2008
Sold by
Pautzke Sarah M
Bought by
Culliton David A and Flowers Dianne R
Current Estimated Value
Purchase Details
Closed on
Sep 14, 2007
Sold by
Countrywide Home Svcs and Securitized Asset Rec
Bought by
Pautzke Sarah M
Purchase Details
Closed on
May 27, 2004
Sold by
Bamford Mary E
Bought by
Bamford Thomas W
Purchase Details
Closed on
Jan 19, 1995
Sold by
Greenfield Area Cmmty
Bought by
Banford Thomas W
Purchase Details
Closed on
Sep 14, 1990
Sold by
Franklin Cty Cmnty Dev
Bought by
Bamford Thomas W
Purchase Details
Closed on
Aug 17, 1990
Sold by
Franklin Cty Cmnty Dev
Bought by
Frnkln Cty Comnty Dev
Create a Home Valuation Report for This Property
The Home Valuation Report is an in-depth analysis detailing your home's value as well as a comparison with similar homes in the area
Home Values in the Area
Average Home Value in this Area
Purchase History
| Date | Buyer | Sale Price | Title Company |
|---|---|---|---|
| Culliton David A | $160,000 | -- | |
| Culliton David A | $160,000 | -- | |
| Pautzke Sarah M | $114,900 | -- | |
| Pautzke Sarah M | $114,900 | -- | |
| Bamford Thomas W | -- | -- | |
| Bamford Thomas W | -- | -- | |
| Banford Thomas W | $7,000 | -- | |
| Banford Thomas W | $7,000 | -- | |
| Bamford Thomas W | $92,350 | -- | |
| Bamford Thomas W | $92,350 | -- | |
| Frnkln Cty Comnty Dev | $79,000 | -- | |
| Frnkln Cty Comnty Dev | $79,000 | -- |
Source: Public Records
Mortgage History
| Date | Status | Borrower | Loan Amount |
|---|---|---|---|
| Open | Frnkln Cty Comnty Dev | $200,285 | |
| Closed | Frnkln Cty Comnty Dev | $199,124 |
Source: Public Records
Tax History
| Year | Tax Paid | Tax Assessment Tax Assessment Total Assessment is a certain percentage of the fair market value that is determined by local assessors to be the total taxable value of land and additions on the property. | Land | Improvement |
|---|---|---|---|---|
| 2025 | $5,148 | $263,200 | $65,300 | $197,900 |
| 2024 | $4,973 | $243,900 | $52,400 | $191,500 |
| 2023 | $4,490 | $228,500 | $52,400 | $176,100 |
| 2022 | $4,149 | $185,900 | $47,500 | $138,400 |
| 2021 | $3,985 | $171,600 | $47,100 | $124,500 |
| 2020 | $3,733 | $162,800 | $42,900 | $119,900 |
| 2019 | $3,515 | $157,200 | $37,300 | $119,900 |
| 2018 | $3,802 | $169,500 | $36,600 | $132,900 |
| 2017 | $3,683 | $169,500 | $36,600 | $132,900 |
| 2016 | $3,634 | $166,600 | $35,200 | $131,400 |
| 2015 | $3,606 | $160,200 | $39,400 | $120,800 |
| 2014 | $3,291 | $160,300 | $39,400 | $120,900 |
Source: Public Records
Map
Nearby Homes
Your Personal Tour Guide
Ask me questions while you tour the home.