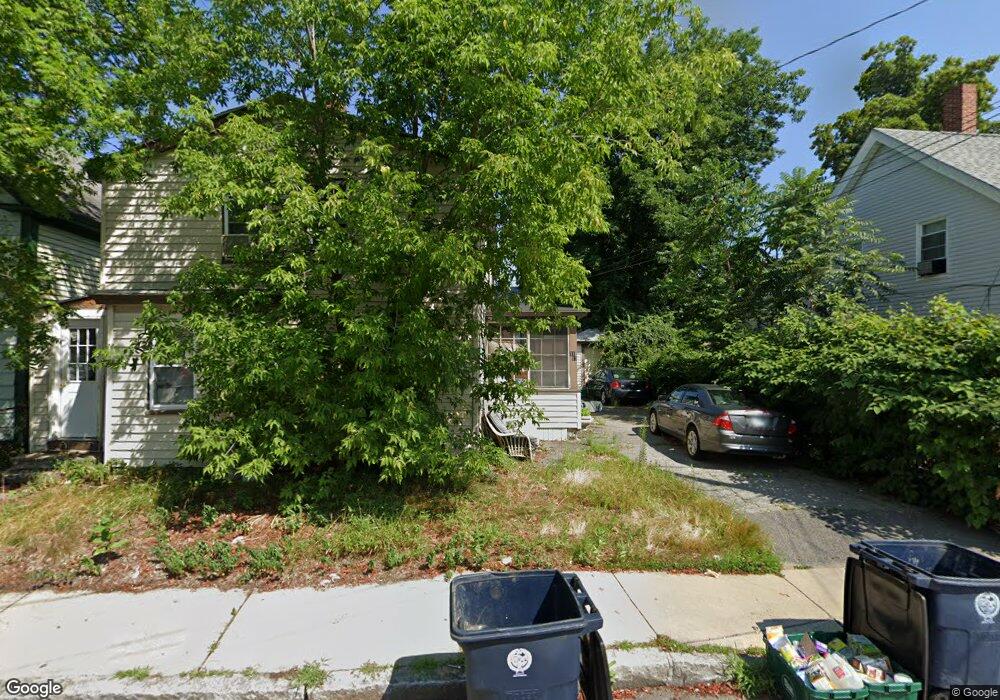
11 Oak St Unit 13 Nashua, NH 03060
Downtown Nashua NeighborhoodEstimated Value: $431,000 - $510,769
2
Beds
2
Baths
2,056
Sq Ft
$226/Sq Ft
Est. Value
About This Home
This home is located at 11 Oak St Unit 13, Nashua, NH 03060 and is currently estimated at $463,692, approximately $225 per square foot. 11 Oak St Unit 13 is a home located in Hillsborough County with nearby schools including Fairgrounds Elementary School, Elm Street Middle School, and Nashua High School South.
Ownership History
Date
Name
Owned For
Owner Type
Purchase Details
Closed on
May 2, 2008
Sold by
Mainville Judith Est and Mainville
Bought by
Anderson Eric and Dellavalle Lou
Current Estimated Value
Home Financials for this Owner
Home Financials are based on the most recent Mortgage that was taken out on this home.
Original Mortgage
$135,000
Outstanding Balance
$84,070
Interest Rate
5.99%
Mortgage Type
Purchase Money Mortgage
Estimated Equity
$379,622
Create a Home Valuation Report for This Property
The Home Valuation Report is an in-depth analysis detailing your home's value as well as a comparison with similar homes in the area
Home Values in the Area
Average Home Value in this Area
Purchase History
| Date | Buyer | Sale Price | Title Company |
|---|---|---|---|
| Anderson Eric | $181,300 | -- |
Source: Public Records
Mortgage History
| Date | Status | Borrower | Loan Amount |
|---|---|---|---|
| Open | Anderson Eric | $135,000 | |
| Previous Owner | Anderson Eric | $1,325 |
Source: Public Records
Tax History
| Year | Tax Paid | Tax Assessment Tax Assessment Total Assessment is a certain percentage of the fair market value that is determined by local assessors to be the total taxable value of land and additions on the property. | Land | Improvement |
|---|---|---|---|---|
| 2025 | $7,641 | $454,000 | $123,800 | $330,200 |
| 2024 | $7,219 | $454,000 | $123,800 | $330,200 |
| 2023 | $6,741 | $369,800 | $99,000 | $270,800 |
| 2022 | $6,682 | $369,800 | $99,000 | $270,800 |
| 2021 | $5,756 | $247,900 | $66,000 | $181,900 |
| 2020 | $5,605 | $247,900 | $66,000 | $181,900 |
| 2019 | $5,394 | $247,900 | $66,000 | $181,900 |
| 2018 | $5,258 | $247,900 | $66,000 | $181,900 |
| 2017 | $4,273 | $165,700 | $62,000 | $103,700 |
| 2016 | $4,154 | $165,700 | $62,000 | $103,700 |
| 2015 | $4,065 | $165,700 | $62,000 | $103,700 |
| 2014 | $3,985 | $165,700 | $62,000 | $103,700 |
Source: Public Records
Map
Nearby Homes
Your Personal Tour Guide
Ask me questions while you tour the home.