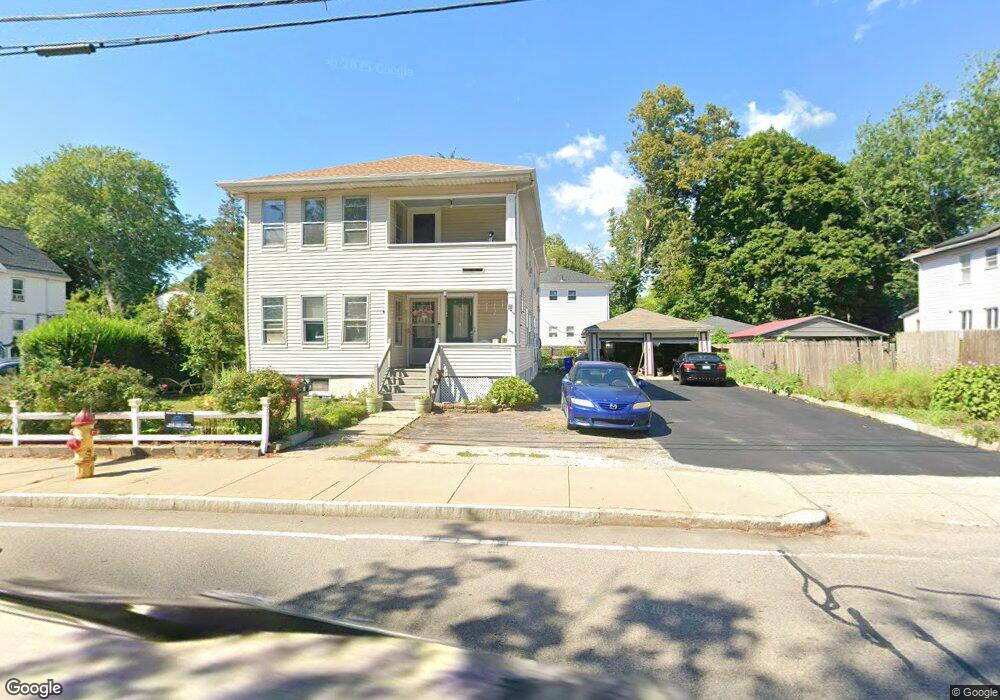
11 Olive St Attleboro, MA 02703
Estimated Value: $502,915 - $710,000
6
Beds
2
Baths
2,560
Sq Ft
$251/Sq Ft
Est. Value
About This Home
This home is located at 11 Olive St, Attleboro, MA 02703 and is currently estimated at $641,479, approximately $250 per square foot. 11 Olive St is a home located in Bristol County with nearby schools including Peter Thacher Elementary School, Cyril K. Brennan Middle School, and Attleboro High School.
Ownership History
Date
Name
Owned For
Owner Type
Purchase Details
Closed on
Jul 7, 2003
Sold by
Tom Samnang
Bought by
Samnang Tom Annie and Samnang Tom
Current Estimated Value
Home Financials for this Owner
Home Financials are based on the most recent Mortgage that was taken out on this home.
Original Mortgage
$140,000
Outstanding Balance
$60,417
Interest Rate
5.46%
Mortgage Type
Purchase Money Mortgage
Estimated Equity
$581,062
Create a Home Valuation Report for This Property
The Home Valuation Report is an in-depth analysis detailing your home's value as well as a comparison with similar homes in the area
Home Values in the Area
Average Home Value in this Area
Purchase History
We collect this data history from publicly available records. To have your information removed, we recommend requesting removal directly through your county’s website.
| Date | Buyer | Sale Price | Title Company |
|---|---|---|---|
| Samnang Tom Annie | -- | -- |
Source: Public Records
Mortgage History
We collect this data history from publicly available records. To have your information removed, we recommend requesting removal directly through your county’s website.
| Date | Status | Borrower | Loan Amount |
|---|---|---|---|
| Open | Samnang Tom Annie | $140,000 |
Source: Public Records
Tax History
| Year | Tax Paid | Tax Assessment Tax Assessment Total Assessment is a certain percentage of the fair market value that is determined by local assessors to be the total taxable value of land and additions on the property. | Land | Improvement |
|---|---|---|---|---|
| 2025 | $5,542 | $441,600 | $115,800 | $325,800 |
| 2024 | $5,377 | $422,400 | $115,800 | $306,600 |
| 2023 | $4,826 | $352,500 | $105,300 | $247,200 |
| 2022 | $4,451 | $308,000 | $100,200 | $207,800 |
| 2021 | $2,205 | $291,700 | $96,400 | $195,300 |
| 2020 | $4,054 | $278,400 | $93,500 | $184,900 |
| 2019 | $3,844 | $271,500 | $91,800 | $179,700 |
| 2018 | $1,983 | $240,100 | $89,000 | $151,100 |
| 2017 | $2,010 | $242,600 | $89,000 | $153,600 |
| 2016 | $3,060 | $206,500 | $83,200 | $123,300 |
| 2015 | $2,907 | $197,600 | $83,200 | $114,400 |
| 2014 | $2,710 | $182,500 | $78,900 | $103,600 |
Source: Public Records
Map
Nearby Homes
- 222-226 S St
- 180 S Main St Unit 12
- 178 S Main St
- 43 Marjorie St
- 4 Wolfenden St
- 70 Riverside Ave
- 35 Hazel St Unit B
- 25 4th St
- 75 Dennis St Unit 3
- 0 Rosedale Ln Unit 73469293
- 64 Mechanic St Unit 3
- 64 Mechanic St
- 40 Park St Unit 4
- 1 Bellmore St
- 40 Falmouth St
- 20 Hodges St
- 142 Fisher St Unit B
- 142 Fisher St Unit A
- 66 Holman St
- 126 Linden St Unit A
- 12 Olive St
- 10 Olive St
- 6 Olive St
- 8 Olive St Unit 1
- 209 Lot 209-B So Main St Unit B
- 7 Olive St
- 209 Lot 209-A So Main St Unit A
- 199 S Main St
- 17 Olive St
- 0 Maple St
- 7 Ellis St
- 8 Ellis St
- 8 Ellis St Unit 10
- 21 Olive St
- 215 S Main St
- 197 S Main St
- 5 Ellis St
- 31 Olive St Unit 2
- 31 Olive St Unit 1
- 31 Olive St Unit 3
Your Personal Tour Guide
Ask me questions while you tour the home.