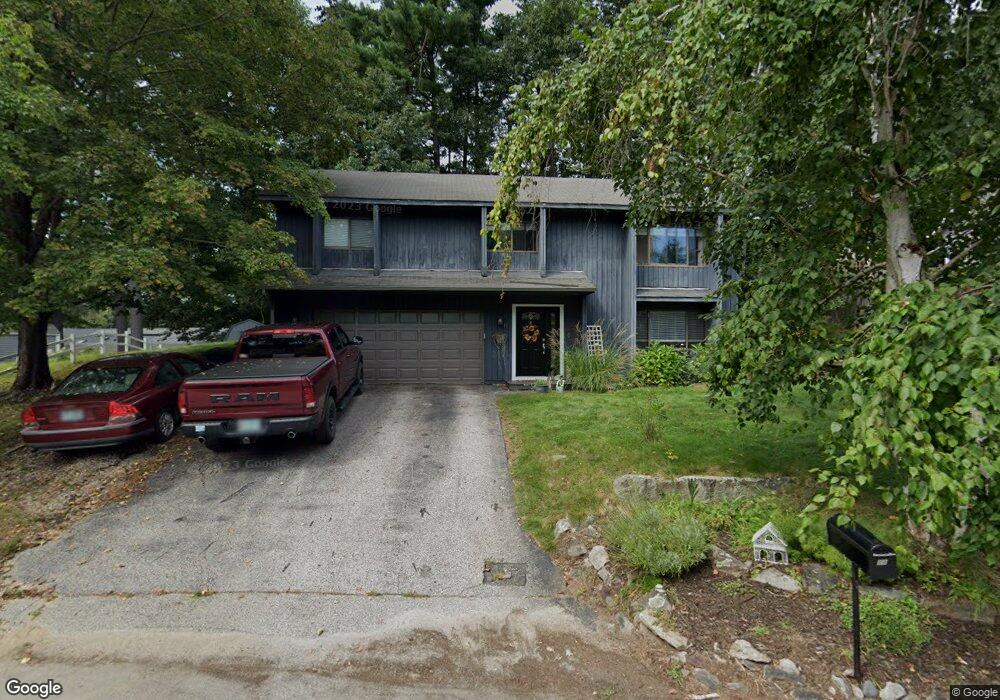
11 Olympia Cir Nashua, NH 03062
West Hollis NeighborhoodEstimated Value: $513,000 - $565,000
3
Beds
2
Baths
1,144
Sq Ft
$466/Sq Ft
Est. Value
About This Home
This home is located at 11 Olympia Cir, Nashua, NH 03062 and is currently estimated at $533,610, approximately $466 per square foot. 11 Olympia Cir is a home located in Hillsborough County with nearby schools including Ledge Street Elementary School, Elm Street Middle School, and Nashua High School South.
Ownership History
Date
Name
Owned For
Owner Type
Purchase Details
Closed on
Jul 11, 2007
Sold by
Hsbc Mortgage Svcs Inc
Bought by
Gott David
Current Estimated Value
Home Financials for this Owner
Home Financials are based on the most recent Mortgage that was taken out on this home.
Original Mortgage
$252,500
Interest Rate
6.48%
Mortgage Type
Purchase Money Mortgage
Purchase Details
Closed on
Apr 27, 2007
Sold by
Carr Joanny and Carr Gregory
Bought by
Mers
Purchase Details
Closed on
May 24, 2004
Sold by
Davenport Eric and Davenport Brandy
Bought by
Carr Joanny and Carr Gregory
Purchase Details
Closed on
Jan 16, 2003
Sold by
Mills Kenneth W and Mills Carinne C
Bought by
Davenport Eric
Purchase Details
Closed on
Nov 24, 1997
Sold by
Sycamore Stephen M
Bought by
Mills Kenneth W and Mills Carinne C
Create a Home Valuation Report for This Property
The Home Valuation Report is an in-depth analysis detailing your home's value as well as a comparison with similar homes in the area
Home Values in the Area
Average Home Value in this Area
Purchase History
| Date | Buyer | Sale Price | Title Company |
|---|---|---|---|
| Gott David | $252,500 | -- | |
| Mers | $228,900 | -- | |
| Carr Joanny | $259,900 | -- | |
| Davenport Eric | $215,000 | -- | |
| Mills Kenneth W | $119,900 | -- |
Source: Public Records
Mortgage History
| Date | Status | Borrower | Loan Amount |
|---|---|---|---|
| Open | Mills Kenneth W | $246,489 | |
| Closed | Mills Kenneth W | $256,000 | |
| Closed | Mills Kenneth W | $252,500 |
Source: Public Records
Tax History Compared to Growth
Tax History
| Year | Tax Paid | Tax Assessment Tax Assessment Total Assessment is a certain percentage of the fair market value that is determined by local assessors to be the total taxable value of land and additions on the property. | Land | Improvement |
|---|---|---|---|---|
| 2024 | $7,681 | $483,100 | $156,400 | $326,700 |
| 2023 | $7,332 | $402,200 | $125,100 | $277,100 |
| 2022 | $7,268 | $402,200 | $125,100 | $277,100 |
| 2021 | $6,513 | $280,500 | $87,600 | $192,900 |
| 2020 | $6,335 | $280,200 | $87,600 | $192,600 |
| 2019 | $6,097 | $280,200 | $87,600 | $192,600 |
| 2018 | $5,943 | $280,200 | $87,600 | $192,600 |
| 2017 | $5,787 | $224,400 | $67,900 | $156,500 |
| 2016 | $5,626 | $224,400 | $67,900 | $156,500 |
| 2015 | $5,490 | $223,800 | $67,900 | $155,900 |
| 2014 | $5,382 | $223,800 | $67,900 | $155,900 |
Source: Public Records
Map
Nearby Homes
- 25 Cortez Dr Unit U57
- 12 Spring Cove Rd Unit U103
- 500 Candlewood Park Unit 21
- 40 Spring Cove Rd Unit U117
- 4 Chesapeake Rd
- 31 Spring Cove Rd Unit U148
- 5 Iris Ct Unit U147
- 47 Dogwood Dr Unit U202
- 20 Martha St
- 38 Dianne St
- 5 Mark St
- 46 Scenic Dr
- 599 W Hollis St
- 5 Cheryl St
- 2 Rene Dr
- 8 Althea Ln Unit U26
- 11 Bartemus Trail Unit 204
- 424 Main Dunstable Rd
- 24 Yarmouth Dr
- 76 Bartemus Trail Unit U231