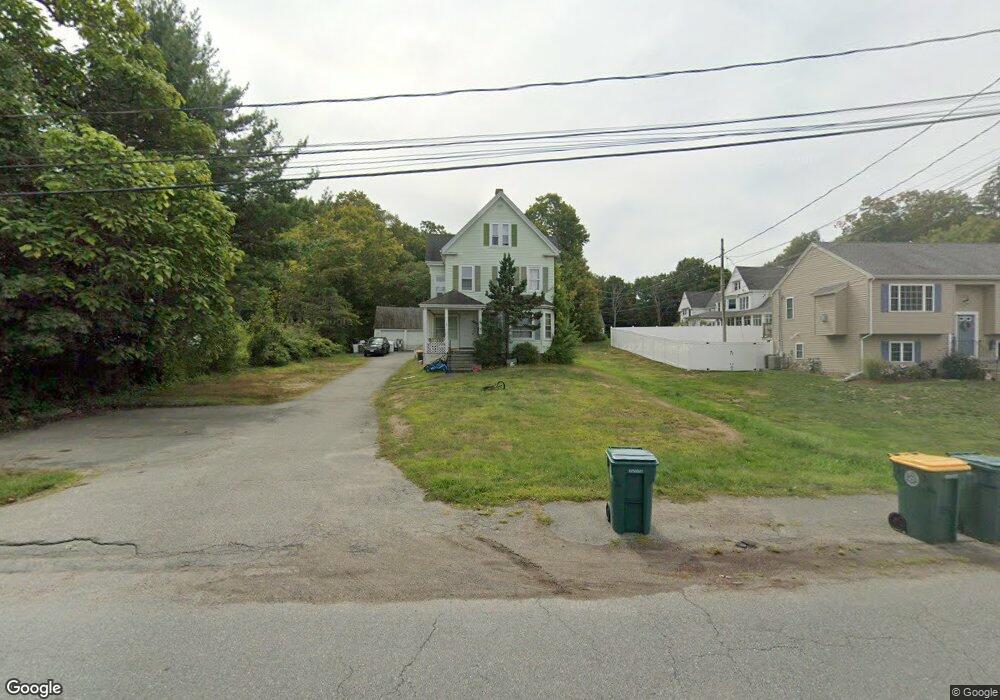
11 Pearl St Abington, MA 02351
Estimated Value: $733,000 - $971,000
8
Beds
3
Baths
2,906
Sq Ft
$288/Sq Ft
Est. Value
About This Home
This home is located at 11 Pearl St, Abington, MA 02351 and is currently estimated at $836,679, approximately $287 per square foot. 11 Pearl St is a home located in Plymouth County with nearby schools including Beaver Brook Elementary School, Abington Middle School, and Woodsdale School.
Ownership History
Date
Name
Owned For
Owner Type
Purchase Details
Closed on
Dec 31, 2012
Sold by
Mcsharry Bros Inc
Bought by
Mbr Rental Group Llc
Current Estimated Value
Purchase Details
Closed on
Nov 13, 2012
Sold by
Underwood Daniel L and Deutsche Bank Natl T C
Bought by
Deutsche Bank Natl T C
Purchase Details
Closed on
May 19, 2008
Sold by
Underwood Daniel
Bought by
Eleven Pearl Street Co
Purchase Details
Closed on
Jun 10, 2005
Sold by
Salomon Immacula
Bought by
Underwood Daniel L
Home Financials for this Owner
Home Financials are based on the most recent Mortgage that was taken out on this home.
Original Mortgage
$366,750
Interest Rate
5.79%
Mortgage Type
Purchase Money Mortgage
Purchase Details
Closed on
Nov 12, 2003
Sold by
Pecoraro John T
Bought by
Salomon Immacula
Purchase Details
Closed on
Apr 21, 1987
Sold by
Thayer Richard A
Bought by
Pecoraro John T
Create a Home Valuation Report for This Property
The Home Valuation Report is an in-depth analysis detailing your home's value as well as a comparison with similar homes in the area
Home Values in the Area
Average Home Value in this Area
Purchase History
| Date | Buyer | Sale Price | Title Company |
|---|---|---|---|
| Mbr Rental Group Llc | -- | -- | |
| Deutsche Bank Natl T C | $208,250 | -- | |
| Eleven Pearl Street Co | -- | -- | |
| Underwood Daniel L | $465,000 | -- | |
| Salomon Immacula | $435,000 | -- | |
| Pecoraro John T | $185,000 | -- |
Source: Public Records
Mortgage History
| Date | Status | Borrower | Loan Amount |
|---|---|---|---|
| Previous Owner | Pecoraro John T | $84,501 | |
| Previous Owner | Pecoraro John T | $366,750 |
Source: Public Records
Tax History
| Year | Tax Paid | Tax Assessment Tax Assessment Total Assessment is a certain percentage of the fair market value that is determined by local assessors to be the total taxable value of land and additions on the property. | Land | Improvement |
|---|---|---|---|---|
| 2025 | $8,223 | $629,600 | $242,200 | $387,400 |
| 2024 | $8,134 | $607,900 | $220,500 | $387,400 |
| 2023 | $8,687 | $611,300 | $192,100 | $419,200 |
| 2022 | $6,896 | $453,100 | $168,500 | $284,600 |
| 2021 | $7,197 | $436,700 | $153,100 | $283,600 |
| 2020 | $7,346 | $432,100 | $148,500 | $283,600 |
| 2019 | $5,820 | $334,700 | $141,600 | $193,100 |
| 2018 | $5,964 | $334,700 | $141,600 | $193,100 |
| 2017 | $5,936 | $323,500 | $141,600 | $181,900 |
| 2016 | $4,283 | $238,900 | $135,000 | $103,900 |
| 2015 | $4,575 | $269,100 | $135,000 | $134,100 |
Source: Public Records
Map
Nearby Homes
- 35 Adams St
- 73 Monroe St
- 0 Bedford St
- 1353 Washington St
- 338 Adams St
- 1065 Bedford St
- 1077 Bedford St
- 120 Glen St
- 7 Carlys Way
- 46 Carey St
- 337 Randolph St
- 20 Birch St
- 135 Grove St Unit 115
- 135 Grove St Unit 133
- 17 Birch St Unit 135
- 40 Fir Rd Unit 386
- 10 Bank St
- 119 Grove St Unit 238
- 119 Grove St Unit 223
- 225 W Water St
Your Personal Tour Guide
Ask me questions while you tour the home.