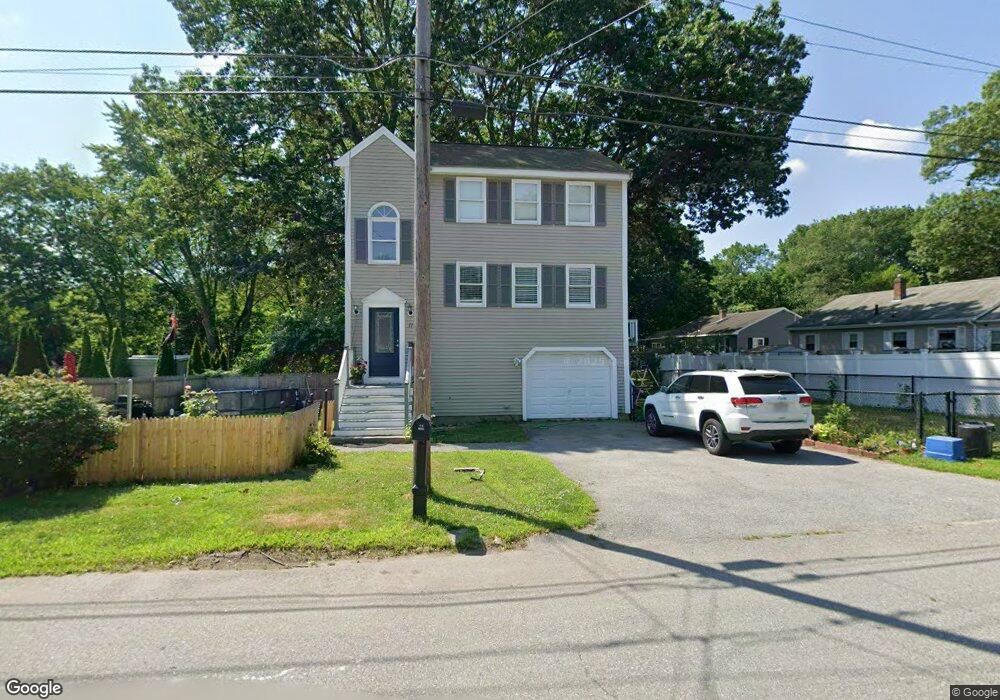
11 Pemberton St Unit 2 Lowell, MA 01850
Centralville NeighborhoodEstimated Value: $492,000 - $514,000
3
Beds
2
Baths
1,358
Sq Ft
$369/Sq Ft
Est. Value
About This Home
This home is located at 11 Pemberton St Unit 2, Lowell, MA 01850 and is currently estimated at $501,346, approximately $369 per square foot. 11 Pemberton St Unit 2 is a home located in Middlesex County with nearby schools including S. Christa McAuliffe Elementary School, Greenhalge Elementary School, and Moody Elementary School.
Ownership History
Date
Name
Owned For
Owner Type
Purchase Details
Closed on
Dec 8, 2017
Sold by
Ferreira Houdes and Ferreira Eneida
Bought by
Lukwago Aidah
Current Estimated Value
Home Financials for this Owner
Home Financials are based on the most recent Mortgage that was taken out on this home.
Original Mortgage
$308,312
Outstanding Balance
$263,725
Interest Rate
4.37%
Mortgage Type
FHA
Estimated Equity
$237,621
Purchase Details
Closed on
Oct 3, 2011
Sold by
Carvalho Sara and Carvalho Ryan
Bought by
Ferreira Houdes and Ferreira Eneida
Home Financials for this Owner
Home Financials are based on the most recent Mortgage that was taken out on this home.
Original Mortgage
$233,818
Interest Rate
4.15%
Mortgage Type
Purchase Money Mortgage
Purchase Details
Closed on
Jun 14, 2002
Sold by
Green Keith W and Green Shannon E
Bought by
Cavalho Ryan and Cavalho Sara
Purchase Details
Closed on
Jun 23, 1994
Sold by
Kitsopoulos Athena
Bought by
Trinity Grp Rt
Create a Home Valuation Report for This Property
The Home Valuation Report is an in-depth analysis detailing your home's value as well as a comparison with similar homes in the area
Home Values in the Area
Average Home Value in this Area
Purchase History
| Date | Buyer | Sale Price | Title Company |
|---|---|---|---|
| Lukwago Aidah | $314,000 | -- | |
| Ferreira Houdes | $239,900 | -- | |
| Ferreira Houdes | $239,900 | -- | |
| Cavalho Ryan | $237,000 | -- | |
| Cavalho Ryan | $237,000 | -- | |
| Trinity Grp Rt | $29,000 | -- | |
| Trinity Grp Rt | $29,000 | -- |
Source: Public Records
Mortgage History
| Date | Status | Borrower | Loan Amount |
|---|---|---|---|
| Open | Lukwago Aidah | $308,312 | |
| Closed | Trinity Grp Rt | $308,312 | |
| Previous Owner | Ferreira Houdes | $233,818 |
Source: Public Records
Tax History
| Year | Tax Paid | Tax Assessment Tax Assessment Total Assessment is a certain percentage of the fair market value that is determined by local assessors to be the total taxable value of land and additions on the property. | Land | Improvement |
|---|---|---|---|---|
| 2025 | $4,781 | $416,500 | $140,300 | $276,200 |
| 2024 | $4,853 | $407,500 | $131,100 | $276,400 |
| 2023 | $4,587 | $369,300 | $114,000 | $255,300 |
| 2022 | $3,817 | $321,600 | $103,600 | $218,000 |
| 2021 | $3,817 | $283,600 | $90,100 | $193,500 |
| 2020 | $3,941 | $295,000 | $105,200 | $189,800 |
| 2019 | $3,702 | $263,700 | $90,000 | $173,700 |
| 2018 | $3,752 | $251,800 | $84,000 | $167,800 |
| 2017 | $3,396 | $227,600 | $69,100 | $158,500 |
| 2016 | $3,366 | $222,000 | $63,500 | $158,500 |
| 2015 | $3,133 | $202,400 | $60,500 | $141,900 |
| 2013 | $3,122 | $208,000 | $76,100 | $131,900 |
Source: Public Records
Map
Nearby Homes
- 175 Willard St Unit 9
- 700 Robbins Ave Unit 6
- 668 Robbins Ave Unit 1
- 1 19th St Unit 3
- 23 18th St
- 35 Whitney Ave Unit 33
- 40 Arlington Ave
- 4 Hazelwood Ave Unit 12
- 69 Arlington St
- 144 Thissell Ave Unit 11
- 1391 Bridge St
- 10 Lanseigne St
- 18 May St
- 54 Montaup Ave
- 367 Hildreth St Unit 33
- 361 Hildreth St Unit 24
- 417 Hildreth St Unit 30
- 106 Methuen St Unit B
- 202 Coburn St
- 163 Newbury St
- 11 Pemberton St
- 225 Humphrey St
- 225 Humphrey St Unit B
- 31 Pemberton St
- 217 Humphrey St
- 12 Pemberton St
- 16 Pemberton St
- 24 Pemberton St
- 33 Pemberton St
- 32 Pemberton St
- 224 Humphrey St
- 232 Humphrey St
- 30 Utica St
- 251 Humphrey St
- 216 Humphrey St
- 240 Humphrey St
- 40 Pemberton St
- 195 Humphrey St
- 43 Pemberton St
- 248 Humphrey St
Your Personal Tour Guide
Ask me questions while you tour the home.