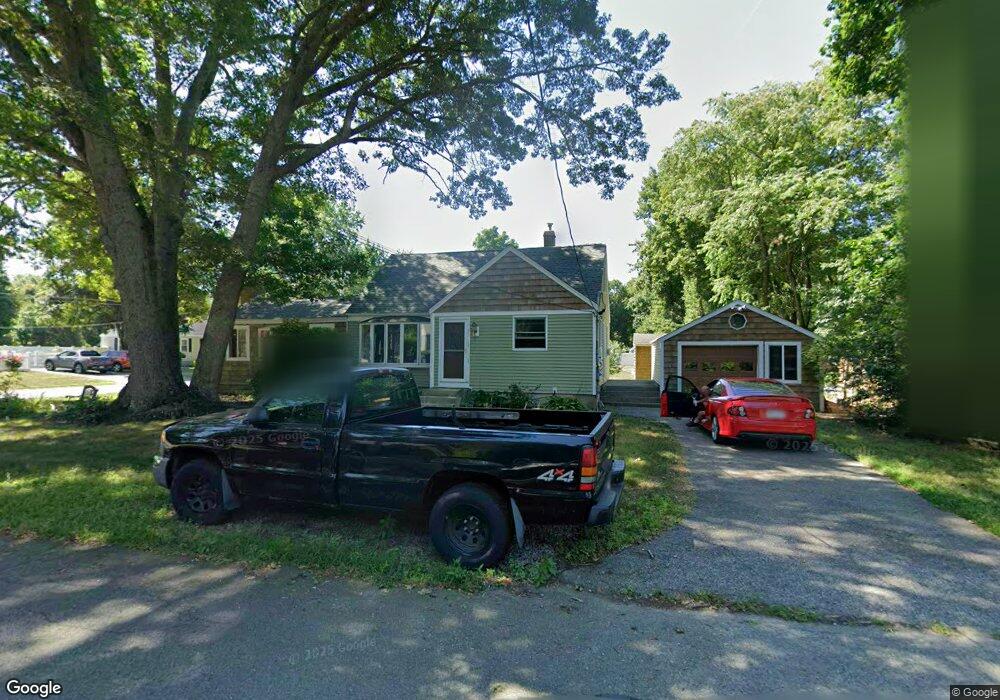
11 Peter St Norton, MA 02766
Estimated Value: $496,706 - $626,000
3
Beds
2
Baths
1,305
Sq Ft
$420/Sq Ft
Est. Value
About This Home
This home is located at 11 Peter St, Norton, MA 02766 and is currently estimated at $547,677, approximately $419 per square foot. 11 Peter St is a home located in Bristol County with nearby schools including J.C. Solmonese Elementary School, Henri A. Yelle Elementary School, and Norton Middle School.
Ownership History
Date
Name
Owned For
Owner Type
Purchase Details
Closed on
Dec 6, 1991
Sold by
Boyle Michael C and Boyle Marie
Bought by
Futyma August and Futyma Tina
Current Estimated Value
Home Financials for this Owner
Home Financials are based on the most recent Mortgage that was taken out on this home.
Original Mortgage
$94,800
Interest Rate
8.82%
Mortgage Type
Purchase Money Mortgage
Create a Home Valuation Report for This Property
The Home Valuation Report is an in-depth analysis detailing your home's value as well as a comparison with similar homes in the area
Home Values in the Area
Average Home Value in this Area
Purchase History
| Date | Buyer | Sale Price | Title Company |
|---|---|---|---|
| Futyma August | $119,350 | -- |
Source: Public Records
Mortgage History
| Date | Status | Borrower | Loan Amount |
|---|---|---|---|
| Open | Futyma August | $30,000 | |
| Closed | Futyma August | $94,800 | |
| Previous Owner | Futyma August | $30,000 |
Source: Public Records
Tax History
| Year | Tax Paid | Tax Assessment Tax Assessment Total Assessment is a certain percentage of the fair market value that is determined by local assessors to be the total taxable value of land and additions on the property. | Land | Improvement |
|---|---|---|---|---|
| 2025 | $53 | $407,500 | $177,900 | $229,600 |
| 2024 | $5,035 | $388,800 | $169,400 | $219,400 |
| 2023 | $4,767 | $367,000 | $159,700 | $207,300 |
| 2022 | $4,636 | $325,100 | $145,200 | $179,900 |
| 2021 | $4,428 | $296,600 | $138,300 | $158,300 |
| 2020 | $4,267 | $288,300 | $134,300 | $154,000 |
| 2019 | $4,138 | $277,700 | $129,200 | $148,500 |
| 2018 | $2,781 | $262,600 | $129,200 | $133,400 |
| 2017 | $3,896 | $253,500 | $129,200 | $124,300 |
| 2016 | $3,799 | $243,400 | $129,200 | $114,200 |
| 2015 | $3,711 | $241,100 | $126,600 | $114,500 |
| 2014 | $3,540 | $230,300 | $120,600 | $109,700 |
Source: Public Records
Map
Nearby Homes
- 170 S Worcester St Unit 3
- 108 S Worcester St
- 2 Edgewater Dr Unit 2
- 26 Barrows Ct
- 34 Barrows St
- 55 Sturdy St
- 127 John Scott Blvd
- 125 John Scott Blvd
- 5 Robin Cir Unit 5
- 20 Lloyd Cir Unit 32
- 14 Lloyd Cir Unit 29
- 143 Oak St Unit 10
- 93 Mansfield Ave
- 8 Kasmira Way
- 3 Gilberts Way
- 180 Pike Ave
- 20 John F. Kennedy Dr
- 90 Pine St
- 65 Godfrey Dr Unit 65
- 14 Country Club Way
Your Personal Tour Guide
Ask me questions while you tour the home.