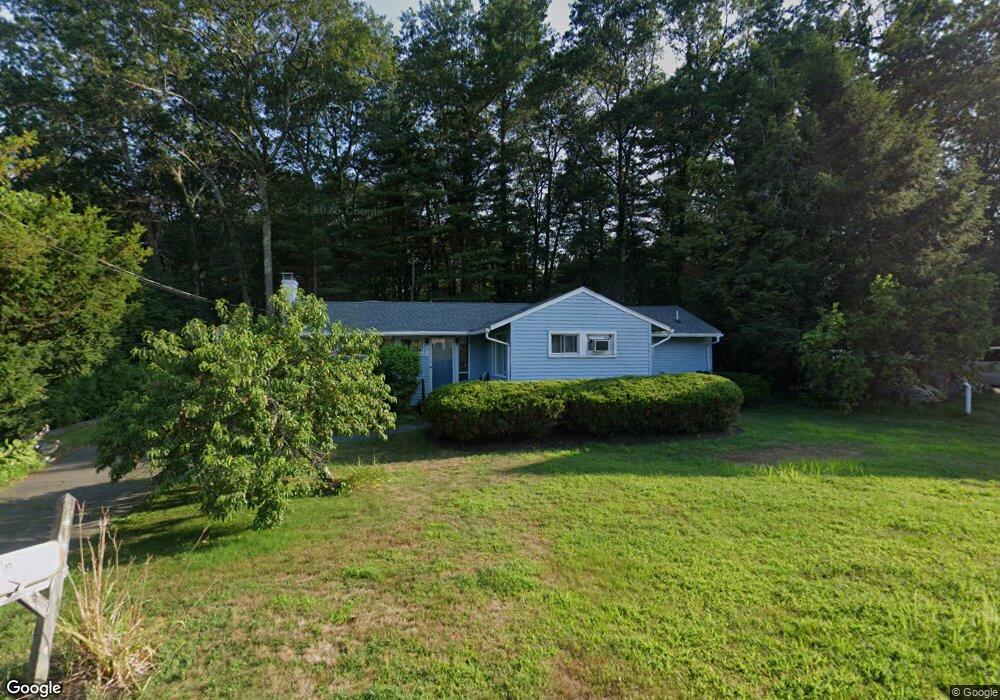
11 Phaneuf St Middleton, MA 01949
Estimated Value: $607,661 - $679,000
3
Beds
2
Baths
1,424
Sq Ft
$454/Sq Ft
Est. Value
About This Home
This home is located at 11 Phaneuf St, Middleton, MA 01949 and is currently estimated at $646,165, approximately $453 per square foot. 11 Phaneuf St is a home located in Essex County with nearby schools including Howe-Manning Elementary School, Fuller Meadow Elementary School, and Masconomet Regional Middle School.
Ownership History
Date
Name
Owned For
Owner Type
Purchase Details
Closed on
Aug 2, 2000
Sold by
Brickle Jeffrey E and Brickle Katharine H
Bought by
Rhuda Jayson A and Rhuda Jennifer C
Current Estimated Value
Purchase Details
Closed on
Nov 30, 1995
Sold by
Smith David and Smith Judy
Bought by
Brickle Jeffrey and Brickle Katharine
Create a Home Valuation Report for This Property
The Home Valuation Report is an in-depth analysis detailing your home's value as well as a comparison with similar homes in the area
Home Values in the Area
Average Home Value in this Area
Purchase History
| Date | Buyer | Sale Price | Title Company |
|---|---|---|---|
| Rhuda Jayson A | $232,400 | -- | |
| Rhuda Jayson A | $232,400 | -- | |
| Brickle Jeffrey | $140,000 | -- | |
| Brickle Jeffrey | $140,000 | -- |
Source: Public Records
Mortgage History
| Date | Status | Borrower | Loan Amount |
|---|---|---|---|
| Open | Brickle Jeffrey | $258,000 | |
| Closed | Brickle Jeffrey | $257,000 |
Source: Public Records
Tax History Compared to Growth
Tax History
| Year | Tax Paid | Tax Assessment Tax Assessment Total Assessment is a certain percentage of the fair market value that is determined by local assessors to be the total taxable value of land and additions on the property. | Land | Improvement |
|---|---|---|---|---|
| 2025 | $6,412 | $539,300 | $324,600 | $214,700 |
| 2024 | $6,571 | $557,300 | $324,600 | $232,700 |
| 2023 | $6,619 | $514,300 | $364,400 | $149,900 |
| 2022 | $5,572 | $420,500 | $266,100 | $154,400 |
| 2021 | $5,194 | $378,600 | $233,900 | $144,700 |
| 2020 | $5,295 | $388,800 | $239,500 | $149,300 |
| 2019 | $5,061 | $369,700 | $231,100 | $138,600 |
| 2018 | $4,374 | $313,300 | $200,300 | $113,000 |
| 2017 | $4,520 | $324,000 | $201,700 | $122,300 |
| 2016 | $4,148 | $298,600 | $179,200 | $119,400 |
| 2015 | $3,831 | $278,000 | $179,200 | $98,800 |
Source: Public Records
Map
Nearby Homes
- 2 Tyler Ln
- 6 White Ln
- 62 Cabral Dr
- 1 Mills Point Unit 1
- 15 Couture Way
- 119 River St
- 28 Niblick Way
- 8 Brookside Rd
- 49 Maple St Unit B
- 44 Brassie Way
- 39 Central St
- 53 N Main St Unit 53
- 37 Peaslee Cir Unit 37
- 103 Elm St
- 5 Theresa Rd
- 10 Oak St
- 10 Callaway Dr Unit 10
- 1466 Main St
- 10 Dogwood Ln
- 89 Forest St