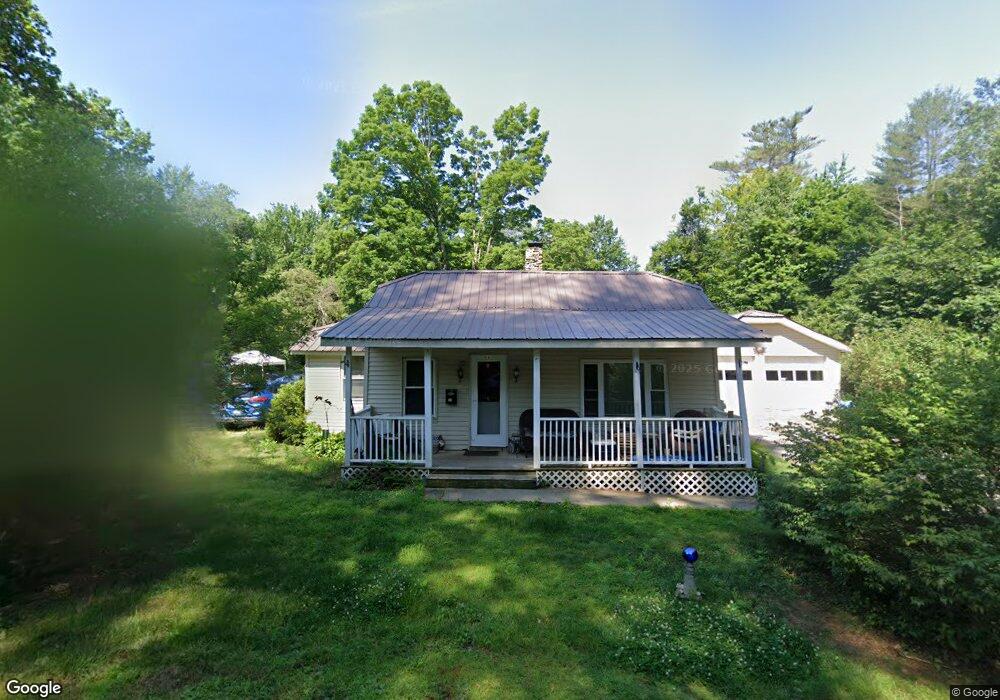
11 Pine Ave Claremont, NH 03743
Maple Avenue District NeighborhoodEstimated Value: $207,000 - $236,000
2
Beds
1
Bath
874
Sq Ft
$252/Sq Ft
Est. Value
About This Home
This home is located at 11 Pine Ave, Claremont, NH 03743 and is currently estimated at $220,097, approximately $251 per square foot. 11 Pine Ave is a home located in Sullivan County with nearby schools including Maple Avenue School, Claremont Middle School, and Stevens High School.
Ownership History
Date
Name
Owned For
Owner Type
Purchase Details
Closed on
Apr 14, 2023
Sold by
Martin Barbara A
Bought by
Sweetsir Robert J and Martin Barbara A
Current Estimated Value
Home Financials for this Owner
Home Financials are based on the most recent Mortgage that was taken out on this home.
Original Mortgage
$94,000
Outstanding Balance
$90,894
Interest Rate
6.6%
Mortgage Type
Stand Alone Refi Refinance Of Original Loan
Estimated Equity
$129,203
Purchase Details
Closed on
Aug 28, 1997
Sold by
Island Assoc Inc
Bought by
Martin Armand R and Martin Barbara A
Home Financials for this Owner
Home Financials are based on the most recent Mortgage that was taken out on this home.
Original Mortgage
$40,000
Interest Rate
7.41%
Create a Home Valuation Report for This Property
The Home Valuation Report is an in-depth analysis detailing your home's value as well as a comparison with similar homes in the area
Home Values in the Area
Average Home Value in this Area
Purchase History
| Date | Buyer | Sale Price | Title Company |
|---|---|---|---|
| Sweetsir Robert J | -- | None Available | |
| Sweetsir Robert J | -- | None Available | |
| Martin Armand R | $60,000 | -- | |
| Martin Armand R | $60,000 | -- |
Source: Public Records
Mortgage History
| Date | Status | Borrower | Loan Amount |
|---|---|---|---|
| Open | Sweetsir Robert J | $94,000 | |
| Closed | Sweetsir Robert J | $94,000 | |
| Previous Owner | Martin Armand R | $98,700 | |
| Previous Owner | Martin Armand R | $90,000 | |
| Previous Owner | Martin Armand R | $88,900 | |
| Previous Owner | Martin Armand R | $40,000 |
Source: Public Records
Tax History
| Year | Tax Paid | Tax Assessment Tax Assessment Total Assessment is a certain percentage of the fair market value that is determined by local assessors to be the total taxable value of land and additions on the property. | Land | Improvement |
|---|---|---|---|---|
| 2025 | $6,151 | $201,400 | $44,700 | $156,700 |
| 2024 | $5,893 | $201,400 | $44,700 | $156,700 |
| 2023 | $5,599 | $201,400 | $44,700 | $156,700 |
| 2022 | $3,968 | $95,200 | $21,900 | $73,300 |
| 2021 | $3,901 | $95,200 | $21,900 | $73,300 |
| 2020 | $3,877 | $95,200 | $21,900 | $73,300 |
| 2019 | $3,833 | $95,200 | $21,900 | $73,300 |
| 2018 | $3,876 | $92,100 | $21,900 | $70,200 |
| 2017 | $3,929 | $92,100 | $21,900 | $70,200 |
| 2016 | $3,925 | $92,100 | $21,900 | $70,200 |
| 2015 | $3,819 | $92,100 | $21,900 | $70,200 |
| 2014 | $3,806 | $92,100 | $21,900 | $70,200 |
| 2013 | $4,785 | $132,000 | $17,500 | $114,500 |
Source: Public Records
Map
Nearby Homes
- 19 Kenyon St
- 8 Lindy Ave
- 409 Sullivan St
- 76 Old Church Rd
- 107 Old Church Rd
- 35 Woodland St
- 40 Goyette Ave
- 145 Grissom Ln
- 110 Lafayette St
- 0 Jarvis Hill Rd Unit 5076512
- 22 Bible Hill Rd
- 237 Pleasant St
- 1 Highland Ave
- 62 Ridge Ave
- 110 Sullivan St
- 50 School St
- 1254 U S 5
- 88 Pleasant St
- 211 North St
- 37 Pleasant St
Your Personal Tour Guide
Ask me questions while you tour the home.