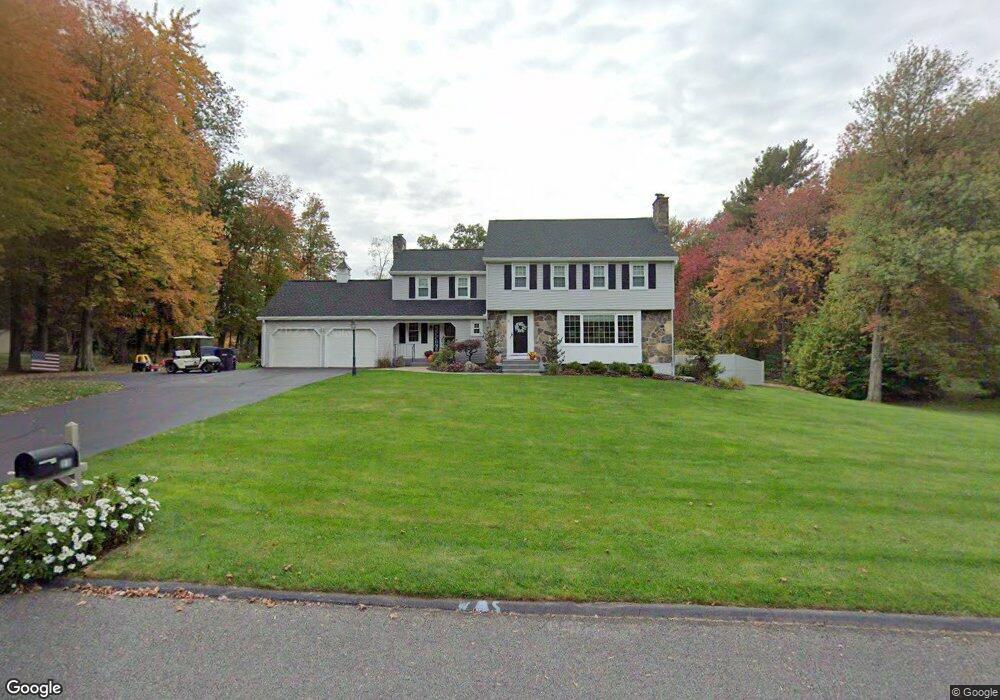
11 Pine Cone Rd Ellington, CT 06029
Estimated Value: $528,842 - $610,000
4
Beds
3
Baths
2,200
Sq Ft
$254/Sq Ft
Est. Value
About This Home
This home is located at 11 Pine Cone Rd, Ellington, CT 06029 and is currently estimated at $559,711, approximately $254 per square foot. 11 Pine Cone Rd is a home located in Tolland County with nearby schools including Ellington High School.
Ownership History
Date
Name
Owned For
Owner Type
Purchase Details
Closed on
Aug 3, 2015
Sold by
Fortin Mary D
Bought by
Bard Devon
Current Estimated Value
Home Financials for this Owner
Home Financials are based on the most recent Mortgage that was taken out on this home.
Original Mortgage
$220,000
Outstanding Balance
$172,675
Interest Rate
3.97%
Estimated Equity
$387,036
Purchase Details
Closed on
Jul 21, 2010
Sold by
Fortin John
Bought by
Fortin Mary
Home Financials for this Owner
Home Financials are based on the most recent Mortgage that was taken out on this home.
Original Mortgage
$80,000
Interest Rate
4.73%
Purchase Details
Closed on
Sep 30, 1992
Sold by
Allen James and Allen Gloria
Bought by
Fortin John and Fortin Mary
Home Financials for this Owner
Home Financials are based on the most recent Mortgage that was taken out on this home.
Original Mortgage
$148,000
Interest Rate
7.83%
Mortgage Type
Unknown
Create a Home Valuation Report for This Property
The Home Valuation Report is an in-depth analysis detailing your home's value as well as a comparison with similar homes in the area
Home Values in the Area
Average Home Value in this Area
Purchase History
| Date | Buyer | Sale Price | Title Company |
|---|---|---|---|
| Bard Devon | $325,000 | -- | |
| Fortin Mary | -- | -- | |
| Fortin John | $185,000 | -- |
Source: Public Records
Mortgage History
| Date | Status | Borrower | Loan Amount |
|---|---|---|---|
| Open | Bard Devon | $220,000 | |
| Previous Owner | Fortin John | $80,000 | |
| Previous Owner | Fortin John | $135,600 | |
| Previous Owner | Fortin John | $148,000 | |
| Previous Owner | Fortin John | $52,500 |
Source: Public Records
Tax History Compared to Growth
Tax History
| Year | Tax Paid | Tax Assessment Tax Assessment Total Assessment is a certain percentage of the fair market value that is determined by local assessors to be the total taxable value of land and additions on the property. | Land | Improvement |
|---|---|---|---|---|
| 2025 | $8,295 | $223,590 | $67,770 | $155,820 |
| 2024 | $8,049 | $223,590 | $67,770 | $155,820 |
| 2023 | $7,669 | $223,590 | $67,770 | $155,820 |
| 2022 | $7,267 | $223,590 | $67,770 | $155,820 |
| 2021 | $7,065 | $223,590 | $67,770 | $155,820 |
| 2020 | $8,057 | $247,140 | $68,540 | $178,600 |
| 2019 | $7,812 | $239,630 | $68,540 | $171,090 |
| 2016 | $7,247 | $237,620 | $68,540 | $169,080 |
| 2015 | $7,247 | $241,790 | $68,540 | $173,250 |
| 2014 | -- | $241,790 | $68,540 | $173,250 |
Source: Public Records
Map
Nearby Homes
- 0 Porter Rd
- 41 Hoffman Rd
- 9 Punkin Dr
- 178 Crystal Lake Rd
- 31 Gail Dr
- 4 Virginia Dr
- 125 Pinnacle Rd
- 0000 Webster Rd
- 89 Crystal Lake Rd Unit T7
- 16 Brookfield Dr
- 24 Bonair Hill Rd
- 89 Muddy Brook Rd
- 8 Sadds Mill Rd
- 67 Partridge Run
- 2 Setting Sun Trail
- 7 Sunset Rd
- 43 Jamestown Rd
- 24 Newell Hill Rd
- 6 Gulf Rd
- 19 Burbank Rd