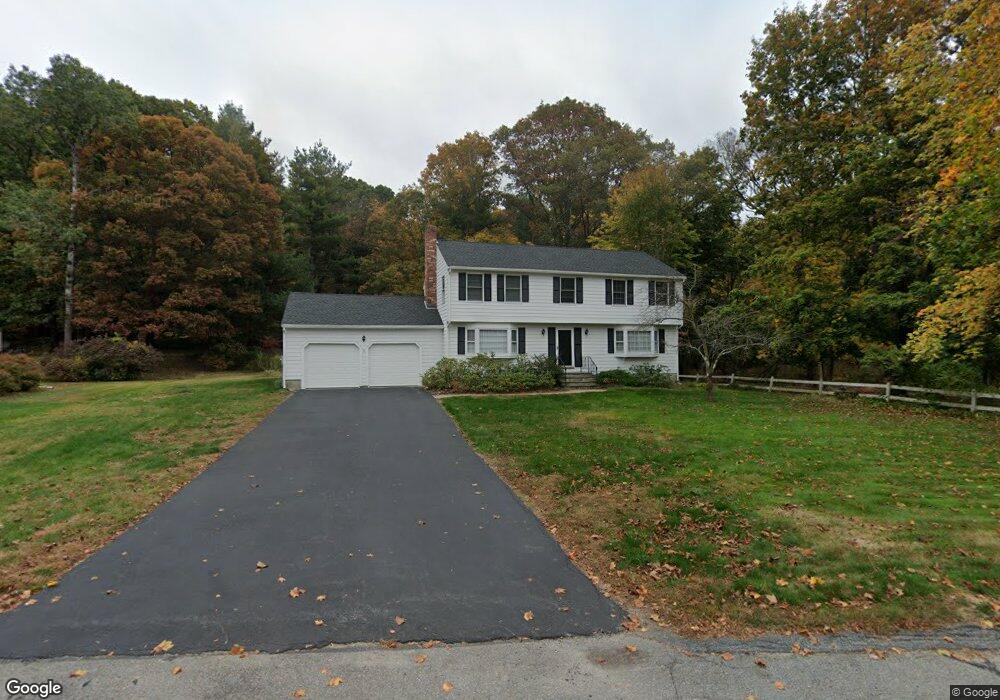
11 Pinecone Ln Southborough, MA 01772
Estimated Value: $838,509 - $1,188,000
4
Beds
3
Baths
2,100
Sq Ft
$471/Sq Ft
Est. Value
About This Home
This home is located at 11 Pinecone Ln, Southborough, MA 01772 and is currently estimated at $989,877, approximately $471 per square foot. 11 Pinecone Ln is a home located in Worcester County with nearby schools including Mary E Finn School, Albert S. Woodward Memorial School, and Margaret A. Neary School.
Ownership History
Date
Name
Owned For
Owner Type
Purchase Details
Closed on
Nov 3, 2015
Sold by
Remington David F and Remington Ruth M
Bought by
Ruth M Remington T and Remington Ruth M
Current Estimated Value
Purchase Details
Closed on
Feb 26, 1988
Sold by
Samuels Richard R
Bought by
Remington David F
Home Financials for this Owner
Home Financials are based on the most recent Mortgage that was taken out on this home.
Original Mortgage
$75,000
Interest Rate
10.49%
Mortgage Type
Purchase Money Mortgage
Create a Home Valuation Report for This Property
The Home Valuation Report is an in-depth analysis detailing your home's value as well as a comparison with similar homes in the area
Home Values in the Area
Average Home Value in this Area
Purchase History
| Date | Buyer | Sale Price | Title Company |
|---|---|---|---|
| Ruth M Remington T | -- | -- | |
| Remington David F | $275,000 | -- |
Source: Public Records
Mortgage History
| Date | Status | Borrower | Loan Amount |
|---|---|---|---|
| Previous Owner | Remington David F | $60,000 | |
| Previous Owner | Remington David F | $75,000 |
Source: Public Records
Tax History
| Year | Tax Paid | Tax Assessment Tax Assessment Total Assessment is a certain percentage of the fair market value that is determined by local assessors to be the total taxable value of land and additions on the property. | Land | Improvement |
|---|---|---|---|---|
| 2025 | $11,335 | $820,800 | $335,100 | $485,700 |
| 2024 | $10,573 | $760,100 | $330,400 | $429,700 |
| 2023 | $10,056 | $681,300 | $312,600 | $368,700 |
| 2022 | $9,519 | $584,700 | $272,000 | $312,700 |
| 2021 | $9,243 | $570,200 | $276,700 | $293,500 |
| 2020 | $9,401 | $564,300 | $269,600 | $294,700 |
| 2019 | $9,368 | $559,600 | $255,300 | $304,300 |
| 2018 | $8,725 | $540,600 | $245,700 | $294,900 |
| 2017 | $8,478 | $517,600 | $245,700 | $271,900 |
| 2016 | $8,309 | $525,200 | $244,400 | $280,800 |
| 2015 | $8,505 | $530,900 | $229,900 | $301,000 |
Source: Public Records
Map
Nearby Homes
- 150 Framingham Rd
- 26 Meadow Ln
- 24 Meadow Ln
- lot 1 Sears Rd
- 1 Carriage Hill Cir Unit 1
- 58 Pine Hill Rd
- 146 Framingham Rd
- 56 Country Ln
- 14 Pinehill Rd
- 216 Boston Rd
- 39 Desimone Dr
- 392 Farm Rd
- 124 Broadmeadow St Unit G
- 35 Roundtop Rd
- 620 Farm Rd
- 10 Lorenzo Dr
- 20 Clifford Rd
- 20 Virginia Ave
- 5 Virginia Ave
- 11 Sonia Dr