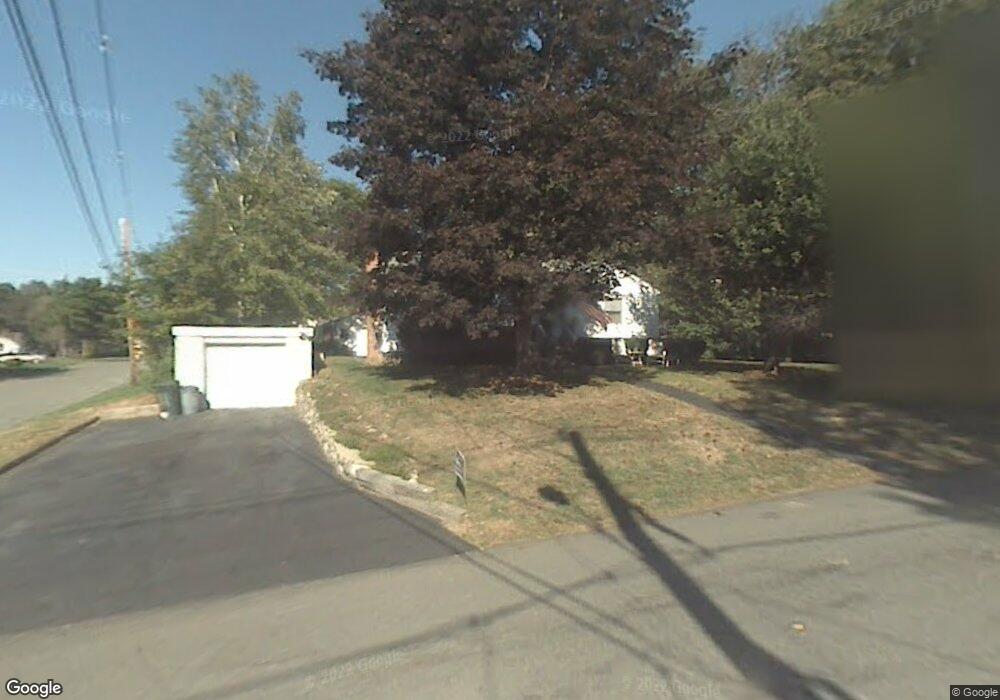
11 Pinecrest Ave Peabody, MA 01960
West Peabody NeighborhoodEstimated Value: $829,000 - $950,000
5
Beds
4
Baths
2,688
Sq Ft
$325/Sq Ft
Est. Value
About This Home
This home is located at 11 Pinecrest Ave, Peabody, MA 01960 and is currently estimated at $874,750, approximately $325 per square foot. 11 Pinecrest Ave is a home located in Essex County with nearby schools including Peabody Veterans Memorial High School, Covenant Christian Academy, and Our Lady Of Assumption School.
Ownership History
Date
Name
Owned For
Owner Type
Purchase Details
Closed on
May 6, 2016
Sold by
Gelin Ellen
Bought by
Ragusa Phillip A
Current Estimated Value
Home Financials for this Owner
Home Financials are based on the most recent Mortgage that was taken out on this home.
Original Mortgage
$365,750
Outstanding Balance
$291,636
Interest Rate
3.71%
Mortgage Type
New Conventional
Estimated Equity
$583,114
Purchase Details
Closed on
Sep 28, 1978
Bought by
Gelin Eric J and Gelin Ellen
Create a Home Valuation Report for This Property
The Home Valuation Report is an in-depth analysis detailing your home's value as well as a comparison with similar homes in the area
Home Values in the Area
Average Home Value in this Area
Purchase History
| Date | Buyer | Sale Price | Title Company |
|---|---|---|---|
| Ragusa Phillip A | $385,000 | -- | |
| Gelin Eric J | -- | -- |
Source: Public Records
Mortgage History
| Date | Status | Borrower | Loan Amount |
|---|---|---|---|
| Open | Gelin Eric J | $50,000 | |
| Open | Ragusa Phillip A | $365,750 | |
| Previous Owner | Gelin Eric J | $90,000 | |
| Previous Owner | Gelin Eric J | $112,000 |
Source: Public Records
Tax History
| Year | Tax Paid | Tax Assessment Tax Assessment Total Assessment is a certain percentage of the fair market value that is determined by local assessors to be the total taxable value of land and additions on the property. | Land | Improvement |
|---|---|---|---|---|
| 2025 | $7,336 | $792,200 | $320,900 | $471,300 |
| 2024 | $6,863 | $752,500 | $320,900 | $431,600 |
| 2023 | $6,601 | $693,400 | $267,500 | $425,900 |
| 2022 | $6,218 | $615,600 | $232,600 | $383,000 |
| 2021 | $5,499 | $524,200 | $211,400 | $312,800 |
| 2020 | $5,424 | $505,000 | $211,400 | $293,600 |
| 2019 | $5,034 | $457,200 | $211,400 | $245,800 |
| 2018 | $4,908 | $428,300 | $188,800 | $239,500 |
| 2017 | $4,909 | $417,400 | $188,800 | $228,600 |
| 2016 | $4,671 | $391,900 | $188,800 | $203,100 |
| 2015 | $4,337 | $352,600 | $188,800 | $163,800 |
Source: Public Records
Map
Nearby Homes
- 15 Monson Dr
- 2 Sachem Rd
- 3 Anne Dr
- 7 Pinewood Rd
- 35 Homestead Rd
- 33 Rockwood Rd
- 715 Summer St
- 4 Lowell St
- 9 Oxbow Rd
- 903 Foxwood Cir Unit 903
- 103 Norris Brook Ln Unit 103
- 103 Foxwood Cir
- 35 Lincoln Ave
- 880 Summer St
- 19 Lindauer St
- 28 Bancroft St
- 24 Worcester Rd
- 9 Tuttle Ln
- 23 Hamilton Rd
- 35 Catherine Dr
Your Personal Tour Guide
Ask me questions while you tour the home.