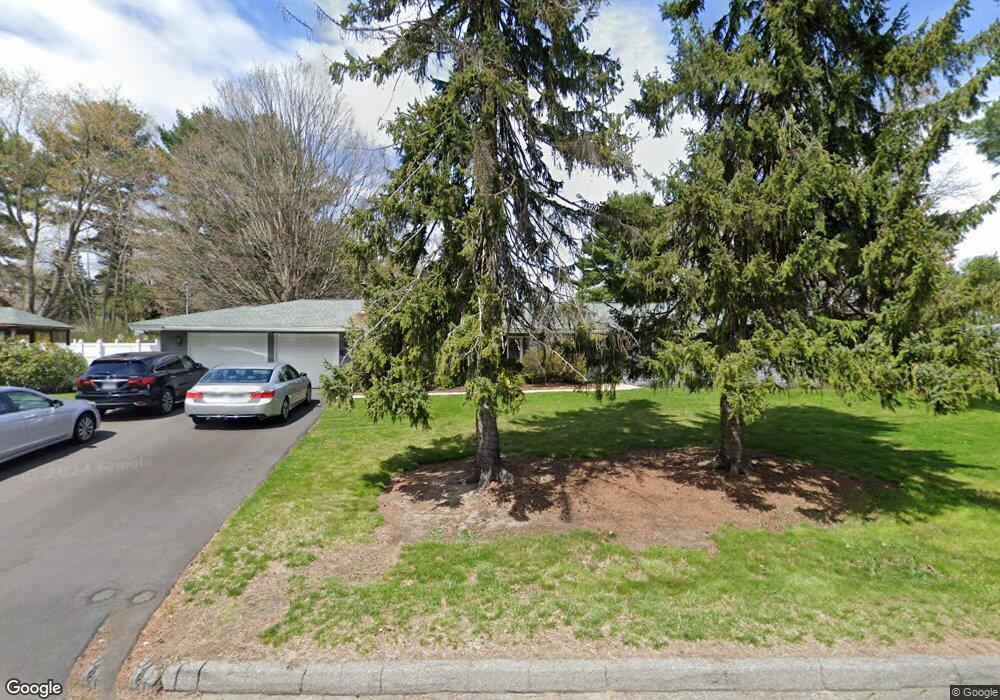
11 Pinewood Dr Framingham, MA 01701
Saxonville NeighborhoodEstimated Value: $723,000 - $777,801
4
Beds
3
Baths
1,872
Sq Ft
$401/Sq Ft
Est. Value
About This Home
This home is located at 11 Pinewood Dr, Framingham, MA 01701 and is currently estimated at $750,950, approximately $401 per square foot. 11 Pinewood Dr is a home located in Middlesex County with nearby schools including Framingham High School, Christa McAuliffe Charter School, and MetroWest Jewish Day School.
Ownership History
Date
Name
Owned For
Owner Type
Purchase Details
Closed on
Dec 27, 2011
Sold by
Letizia Deborah A and Letizia Joseph M
Bought by
Wood Joncody J and Ho Thuy T
Current Estimated Value
Home Financials for this Owner
Home Financials are based on the most recent Mortgage that was taken out on this home.
Original Mortgage
$323,351
Outstanding Balance
$221,786
Interest Rate
3.99%
Mortgage Type
Purchase Money Mortgage
Estimated Equity
$529,164
Purchase Details
Closed on
Sep 9, 2004
Sold by
Berardi Mary K and Berardi Peter P
Bought by
Letizia Deborah A
Create a Home Valuation Report for This Property
The Home Valuation Report is an in-depth analysis detailing your home's value as well as a comparison with similar homes in the area
Home Values in the Area
Average Home Value in this Area
Purchase History
| Date | Buyer | Sale Price | Title Company |
|---|---|---|---|
| Wood Joncody J | $338,000 | -- | |
| Wood Joncody J | $338,000 | -- | |
| Letizia Deborah A | $432,000 | -- | |
| Letizia Deborah A | $432,000 | -- |
Source: Public Records
Mortgage History
| Date | Status | Borrower | Loan Amount |
|---|---|---|---|
| Open | Wood Joncody J | $323,351 | |
| Closed | Letizia Deborah A | $323,351 | |
| Previous Owner | Letizia Deborah A | $75,000 | |
| Previous Owner | Letizia Deborah A | $16,000 |
Source: Public Records
Tax History
| Year | Tax Paid | Tax Assessment Tax Assessment Total Assessment is a certain percentage of the fair market value that is determined by local assessors to be the total taxable value of land and additions on the property. | Land | Improvement |
|---|---|---|---|---|
| 2025 | $7,988 | $669,000 | $271,100 | $397,900 |
| 2024 | $7,334 | $588,600 | $242,200 | $346,400 |
| 2023 | $6,989 | $533,900 | $216,100 | $317,800 |
| 2022 | $6,638 | $483,100 | $196,100 | $287,000 |
| 2021 | $6,443 | $458,600 | $188,500 | $270,100 |
| 2020 | $6,468 | $431,800 | $171,300 | $260,500 |
| 2019 | $6,281 | $408,400 | $171,300 | $237,100 |
| 2018 | $6,097 | $373,600 | $164,900 | $208,700 |
| 2017 | $5,904 | $353,300 | $160,100 | $193,200 |
| 2016 | $6,026 | $346,700 | $160,100 | $186,600 |
| 2015 | $6,020 | $337,800 | $160,700 | $177,100 |
Source: Public Records
Map
Nearby Homes
- 19 Park Ave
- 11 Edith Rd
- 227 Water St
- 4 Tartufi Cir
- 11 Danforth Park Rd
- 21 Potter Rd
- 189 Danforth St
- 30 A St
- 18 Jay Dr
- 231 Central St
- 472 Potter Rd
- 226 Stonebridge Rd
- 18 Brigati Terrace
- 10 Rolling Ln
- 63 Landham Rd
- 689 Old Connecticut Path
- 35 Gleason St
- 33 Oak Hill Rd
- 0 Wagonwheel Rd
- 454 Old Connecticut Path
Your Personal Tour Guide
Ask me questions while you tour the home.