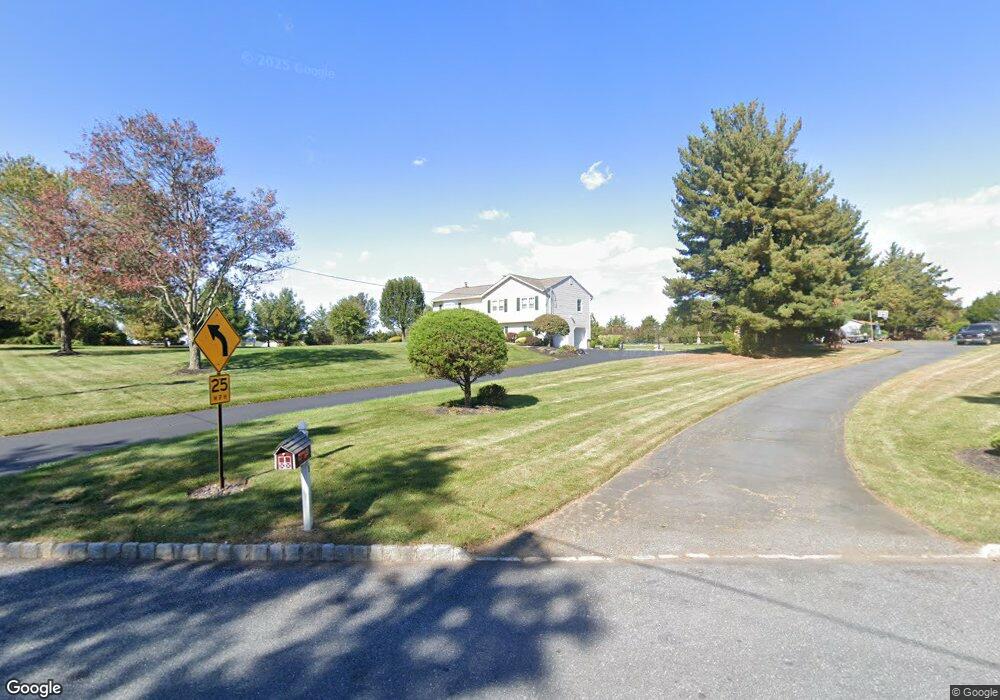
11 Plennert Rd Flemington, NJ 08822
Estimated Value: $544,935 - $691,000
--
Bed
--
Bath
1,976
Sq Ft
$319/Sq Ft
Est. Value
About This Home
This home is located at 11 Plennert Rd, Flemington, NJ 08822 and is currently estimated at $629,734, approximately $318 per square foot. 11 Plennert Rd is a home located in Hunterdon County with nearby schools including Copper Hill School, J.P. Case Middle School, and Reading Fleming Intermediate School.
Ownership History
Date
Name
Owned For
Owner Type
Purchase Details
Closed on
Jun 14, 2006
Sold by
Callahan Christian A and Callahan Colleen J
Bought by
Mack Joseph M and Mack Eleanor
Current Estimated Value
Home Financials for this Owner
Home Financials are based on the most recent Mortgage that was taken out on this home.
Original Mortgage
$287,850
Outstanding Balance
$169,422
Interest Rate
6.59%
Mortgage Type
Purchase Money Mortgage
Estimated Equity
$460,312
Purchase Details
Closed on
Feb 3, 1997
Sold by
Bozarth Frank C and Bozarth Barbara S
Bought by
Callahan Christian A and Callahan Colleen J
Home Financials for this Owner
Home Financials are based on the most recent Mortgage that was taken out on this home.
Original Mortgage
$171,000
Interest Rate
9.5%
Purchase Details
Closed on
Nov 12, 1992
Sold by
Roushey Thomas and Roushey Patricia
Bought by
Bozarth Frank C and Bozarth Barbara S
Create a Home Valuation Report for This Property
The Home Valuation Report is an in-depth analysis detailing your home's value as well as a comparison with similar homes in the area
Home Values in the Area
Average Home Value in this Area
Purchase History
| Date | Buyer | Sale Price | Title Company |
|---|---|---|---|
| Mack Joseph M | $472,900 | Affiliated Title Of North Je | |
| Callahan Christian A | $190,000 | -- | |
| Bozarth Frank C | $192,000 | -- |
Source: Public Records
Mortgage History
| Date | Status | Borrower | Loan Amount |
|---|---|---|---|
| Open | Mack Joseph M | $287,850 | |
| Previous Owner | Callahan Christian A | $171,000 |
Source: Public Records
Tax History Compared to Growth
Tax History
| Year | Tax Paid | Tax Assessment Tax Assessment Total Assessment is a certain percentage of the fair market value that is determined by local assessors to be the total taxable value of land and additions on the property. | Land | Improvement |
|---|---|---|---|---|
| 2025 | $9,951 | $343,500 | $179,700 | $163,800 |
| 2024 | $9,357 | $343,500 | $179,700 | $163,800 |
| 2023 | $9,357 | $343,500 | $179,700 | $163,800 |
| 2022 | $9,120 | $343,500 | $179,700 | $163,800 |
| 2021 | $8,403 | $343,500 | $179,700 | $163,800 |
| 2020 | $8,831 | $343,500 | $179,700 | $163,800 |
| 2019 | $8,653 | $343,500 | $179,700 | $163,800 |
| 2018 | $8,546 | $343,500 | $179,700 | $163,800 |
| 2017 | $8,416 | $343,500 | $179,700 | $163,800 |
| 2016 | $8,265 | $343,500 | $179,700 | $163,800 |
| 2015 | $7,805 | $343,500 | $179,700 | $163,800 |
| 2014 | $7,699 | $343,500 | $179,700 | $163,800 |
Source: Public Records
Map
Nearby Homes