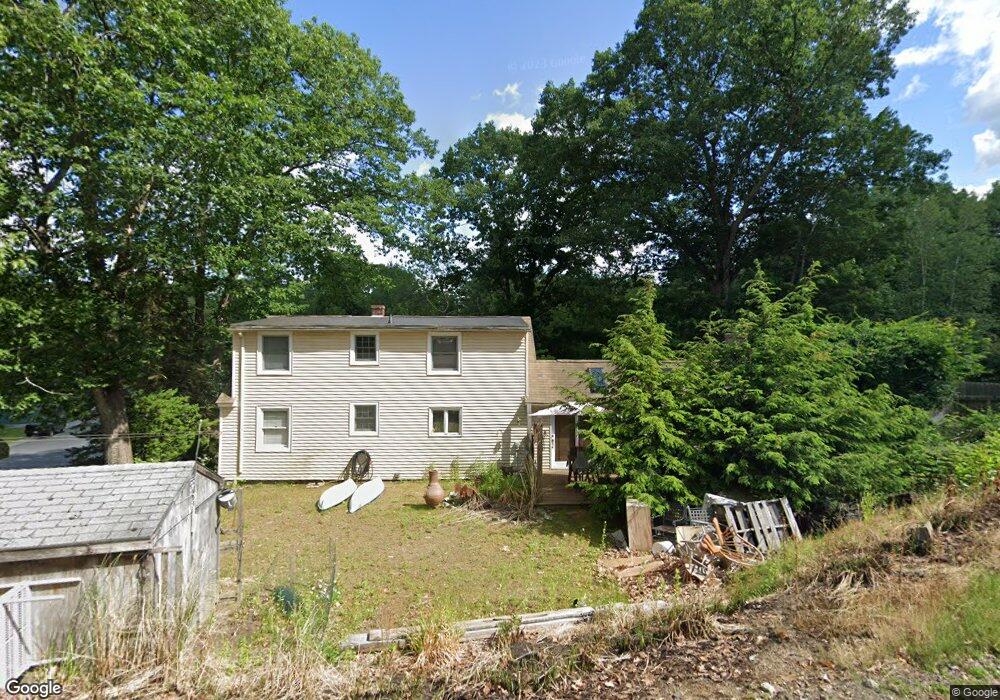
11 Pollier Way Auburn, MA 01501
Stoneville NeighborhoodEstimated Value: $512,000 - $616,000
4
Beds
4
Baths
2,603
Sq Ft
$223/Sq Ft
Est. Value
About This Home
This home is located at 11 Pollier Way, Auburn, MA 01501 and is currently estimated at $580,348, approximately $222 per square foot. 11 Pollier Way is a home located in Worcester County with nearby schools including Auburn Senior High School and Shrewsbury Montessori School - Auburn Campus.
Ownership History
Date
Name
Owned For
Owner Type
Purchase Details
Closed on
Oct 23, 2013
Sold by
Seith Kent L and Seith Maureen
Bought by
Graveson Jeffrey S
Current Estimated Value
Home Financials for this Owner
Home Financials are based on the most recent Mortgage that was taken out on this home.
Original Mortgage
$90,000
Outstanding Balance
$67,785
Interest Rate
4.56%
Mortgage Type
New Conventional
Estimated Equity
$512,563
Create a Home Valuation Report for This Property
The Home Valuation Report is an in-depth analysis detailing your home's value as well as a comparison with similar homes in the area
Home Values in the Area
Average Home Value in this Area
Purchase History
| Date | Buyer | Sale Price | Title Company |
|---|---|---|---|
| Graveson Jeffrey S | $146,000 | -- | |
| Graveson Jeffrey S | $146,000 | -- |
Source: Public Records
Mortgage History
| Date | Status | Borrower | Loan Amount |
|---|---|---|---|
| Open | Graveson Jeffrey S | $90,000 | |
| Closed | Graveson Jeffrey S | $90,000 |
Source: Public Records
Tax History Compared to Growth
Tax History
| Year | Tax Paid | Tax Assessment Tax Assessment Total Assessment is a certain percentage of the fair market value that is determined by local assessors to be the total taxable value of land and additions on the property. | Land | Improvement |
|---|---|---|---|---|
| 2025 | $68 | $476,200 | $117,500 | $358,700 |
| 2024 | $6,902 | $462,300 | $113,100 | $349,200 |
| 2023 | $6,882 | $433,400 | $102,800 | $330,600 |
| 2022 | $6,432 | $382,400 | $102,800 | $279,600 |
| 2021 | $6,260 | $345,100 | $90,800 | $254,300 |
| 2020 | $5,953 | $331,100 | $90,800 | $240,300 |
| 2019 | $5,905 | $320,600 | $90,000 | $230,600 |
| 2018 | $7,083 | $314,200 | $84,200 | $230,000 |
| 2017 | $5,568 | $303,600 | $76,400 | $227,200 |
| 2016 | $4,845 | $267,800 | $78,800 | $189,000 |
| 2015 | $3,012 | $174,500 | $78,800 | $95,700 |
| 2014 | $2,941 | $170,100 | $79,000 | $91,100 |
Source: Public Records
Map
Nearby Homes