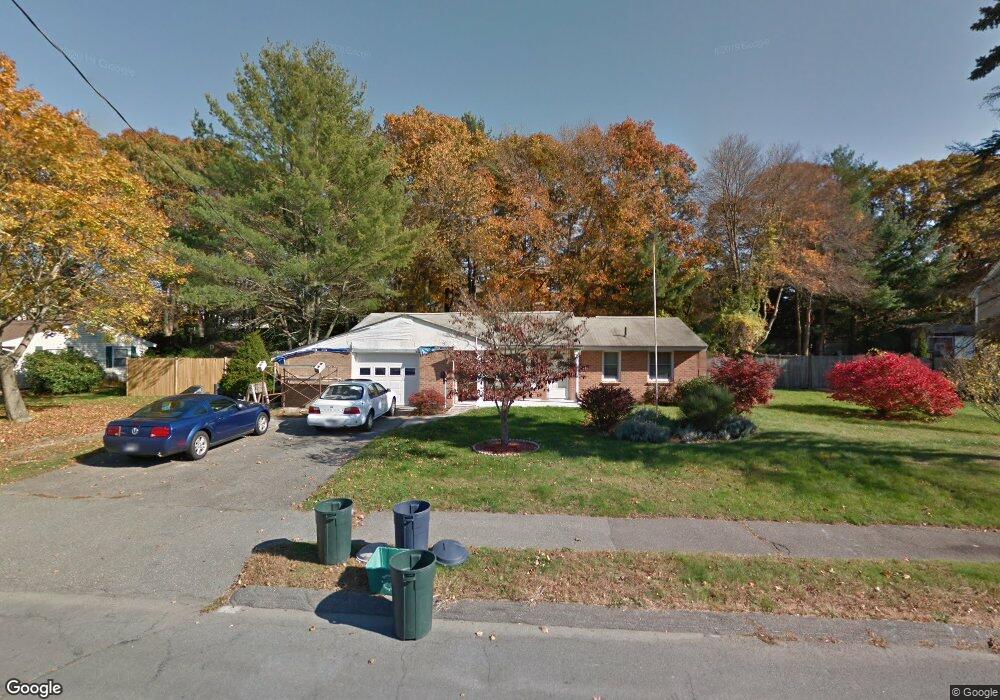
11 Princeton St Danvers, MA 01923
Estimated Value: $597,256 - $627,000
3
Beds
1
Bath
984
Sq Ft
$626/Sq Ft
Est. Value
About This Home
This home is located at 11 Princeton St, Danvers, MA 01923 and is currently estimated at $615,564, approximately $625 per square foot. 11 Princeton St is a home located in Essex County with nearby schools including Danvers High School, St. Mary of the Annunciation School, and North Shore Christian School.
Ownership History
Date
Name
Owned For
Owner Type
Purchase Details
Closed on
Oct 28, 2013
Sold by
Maguire Rose M and Maguire Ryan S
Bought by
Maguire Wayne T and Maguire Ryan S
Current Estimated Value
Purchase Details
Closed on
Mar 29, 2005
Sold by
Maguire Rose Marie and Maguire Wayne F
Bought by
Maguire Rose Marie
Home Financials for this Owner
Home Financials are based on the most recent Mortgage that was taken out on this home.
Original Mortgage
$277,500
Interest Rate
5.87%
Purchase Details
Closed on
Jul 16, 1985
Bought by
Maguire Wayne Thomas and Maguire Ryan Scott
Create a Home Valuation Report for This Property
The Home Valuation Report is an in-depth analysis detailing your home's value as well as a comparison with similar homes in the area
Home Values in the Area
Average Home Value in this Area
Purchase History
| Date | Buyer | Sale Price | Title Company |
|---|---|---|---|
| Maguire Wayne T | -- | -- | |
| Maguire Rose Marie | -- | -- | |
| Maguire Wayne Thomas | -- | -- |
Source: Public Records
Mortgage History
| Date | Status | Borrower | Loan Amount |
|---|---|---|---|
| Previous Owner | Maguire Wayne Thomas | $277,500 | |
| Previous Owner | Maguire Wayne Thomas | $217,356 |
Source: Public Records
Tax History
| Year | Tax Paid | Tax Assessment Tax Assessment Total Assessment is a certain percentage of the fair market value that is determined by local assessors to be the total taxable value of land and additions on the property. | Land | Improvement |
|---|---|---|---|---|
| 2025 | $5,749 | $523,100 | $376,700 | $146,400 |
| 2024 | $5,726 | $515,400 | $376,700 | $138,700 |
| 2023 | $5,558 | $473,000 | $342,400 | $130,600 |
| 2022 | $5,440 | $429,700 | $310,600 | $119,100 |
| 2021 | $5,276 | $395,200 | $294,300 | $100,900 |
| 2020 | $5,120 | $392,000 | $290,800 | $101,200 |
| 2019 | $4,855 | $365,600 | $264,400 | $101,200 |
| 2018 | $4,755 | $351,200 | $261,700 | $89,500 |
| 2017 | $4,497 | $316,900 | $228,700 | $88,200 |
| 2016 | $4,291 | $302,200 | $218,100 | $84,100 |
| 2015 | $4,112 | $275,800 | $198,300 | $77,500 |
Source: Public Records
Map
Nearby Homes
- 13 Princeton St
- 9 Princeton St
- 20 Trinity St
- 22 Trinity St
- 16 Princeton St
- 18 Princeton St
- 18 Trinity St
- 7 Princeton St
- 15 Princeton St
- 24 Trinity St
- 14 Princeton St
- 20 Princeton St
- 16 Trinity St
- 19 Trinity St
- 21 Trinity St
- 12 Princeton St
- 17 Princeton St
- 5 Princeton St
- 22 Princeton St
- 17 Trinity St
Your Personal Tour Guide
Ask me questions while you tour the home.