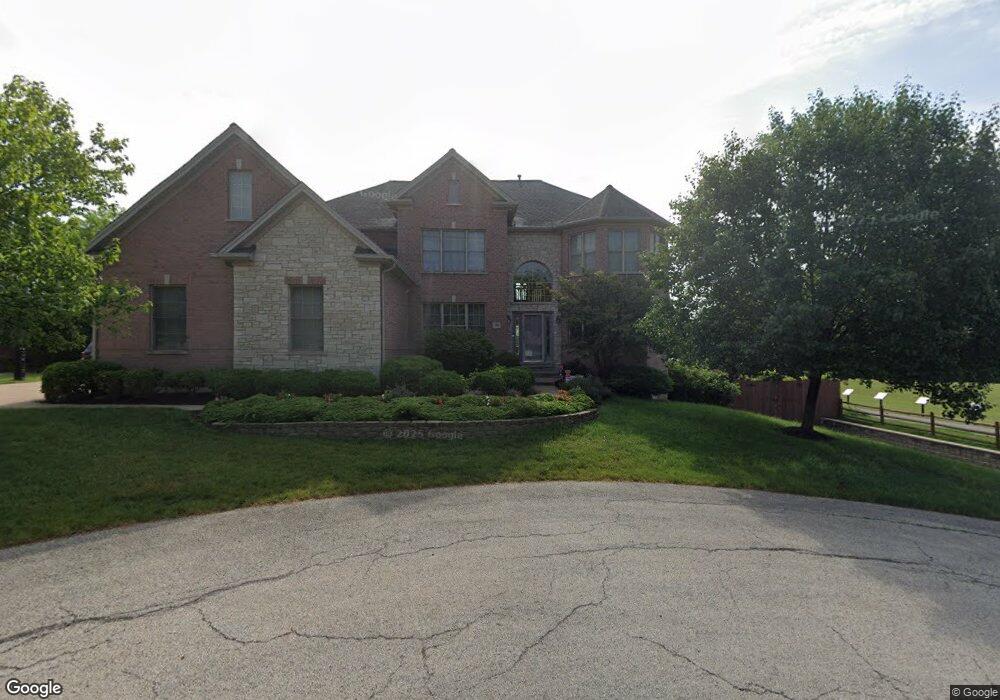
11 Prospect Ct Prospect Heights, IL 60070
Estimated Value: $826,692 - $1,005,000
4
Beds
3
Baths
3,847
Sq Ft
$241/Sq Ft
Est. Value
About This Home
This home is located at 11 Prospect Ct, Prospect Heights, IL 60070 and is currently estimated at $926,923, approximately $240 per square foot. 11 Prospect Ct is a home located in Cook County with nearby schools including Dwight D Eisenhower Elementary School, Anne Sullivan Elementary School, and Betsy Ross Elementary School.
Ownership History
Date
Name
Owned For
Owner Type
Purchase Details
Closed on
Aug 15, 2005
Sold by
Brentwood Development Inc
Bought by
Mabry Michael E and Mabry Melissa A
Current Estimated Value
Home Financials for this Owner
Home Financials are based on the most recent Mortgage that was taken out on this home.
Original Mortgage
$725,000
Outstanding Balance
$387,437
Interest Rate
5.93%
Mortgage Type
Fannie Mae Freddie Mac
Estimated Equity
$539,486
Create a Home Valuation Report for This Property
The Home Valuation Report is an in-depth analysis detailing your home's value as well as a comparison with similar homes in the area
Home Values in the Area
Average Home Value in this Area
Purchase History
| Date | Buyer | Sale Price | Title Company |
|---|---|---|---|
| Mabry Michael E | $943,000 | First American Title |
Source: Public Records
Mortgage History
| Date | Status | Borrower | Loan Amount |
|---|---|---|---|
| Open | Mabry Michael E | $725,000 |
Source: Public Records
Tax History Compared to Growth
Tax History
| Year | Tax Paid | Tax Assessment Tax Assessment Total Assessment is a certain percentage of the fair market value that is determined by local assessors to be the total taxable value of land and additions on the property. | Land | Improvement |
|---|---|---|---|---|
| 2024 | $15,067 | $53,450 | $8,016 | $45,434 |
| 2023 | $16,517 | $53,450 | $8,016 | $45,434 |
| 2022 | $16,517 | $62,036 | $8,016 | $54,020 |
| 2021 | $16,609 | $53,985 | $7,013 | $46,972 |
| 2020 | $16,780 | $55,945 | $7,013 | $48,932 |
| 2019 | $16,765 | $62,579 | $7,013 | $55,566 |
| 2018 | $16,470 | $56,714 | $6,011 | $50,703 |
| 2017 | $17,562 | $60,831 | $6,011 | $54,820 |
| 2016 | $16,597 | $60,831 | $6,011 | $54,820 |
| 2015 | $16,958 | $56,597 | $5,009 | $51,588 |
| 2014 | $16,796 | $56,597 | $5,009 | $51,588 |
| 2013 | $19,275 | $66,192 | $5,009 | $61,183 |
Source: Public Records
Map
Nearby Homes
- 211 W Hanover Place Unit T85
- 107 W Brighton Place Unit T12
- 1428 N Bridgeport Dr Unit T37
- 802 Butternut Ln Unit C
- 802 Butternut Ln Unit D
- 1400 N Yarmouth Place Unit 113
- 1400 N Yarmouth Place Unit 315
- 412 W Olive Ave
- 910 Persimmon Ln Unit A
- 1401 Plum Ct Unit D
- 1311 Nutmeg Ct Unit A
- 740 Creekside Dr Unit 510D
- 1400 N Elmhurst Rd Unit 302
- 1400 N Elmhurst Rd Unit 106
- 730 Creekside Dr Unit 405C
- 2420 E Brandenberry Ct Unit 4C
- 2424 E Oakton St Unit 3C
- 2443 E Brandenberry Ct Unit 2A
- 2443 E Brandenberry Ct Unit 1B
- 2431 E Brandenberry Ct Unit 2O
- 13 Prospect Ct
- 101 Prospect Ct
- 10 Prospect Ct
- 12 Prospect Ct
- 103 Prospect Ct
- 105 Prospect Ct
- 102 Prospect Ct
- 100 Elm St
- 100 Elm St
- 102 Elm St
- 104 Prospect Ct
- 107 Prospect Ct
- 106 Prospect Ct
- 11 N Schoenbeck Rd
- 104 Elm St
- 106 Elm St
- 15 N Schoenbeck Rd
- 3 N Schoenbeck Rd
- 110 E Camp Mcdonald Rd
- 101 N Schoenbeck Rd