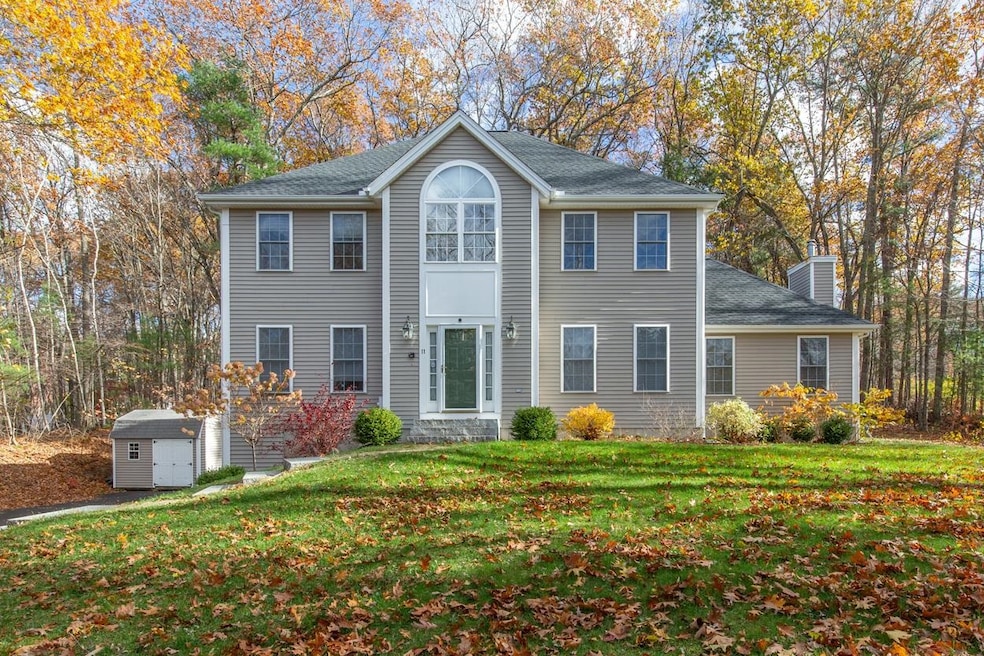
11 Queens Way MerriMacK, NH 03054
Estimated payment $5,025/month
Highlights
- Colonial Architecture
- Recreation Room
- Wood Flooring
- Deck
- Cathedral Ceiling
- Whirlpool Bathtub
About This Home
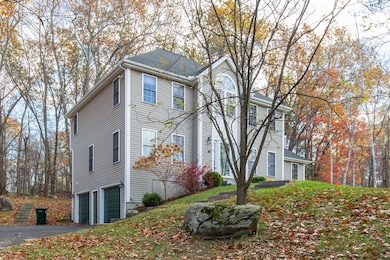
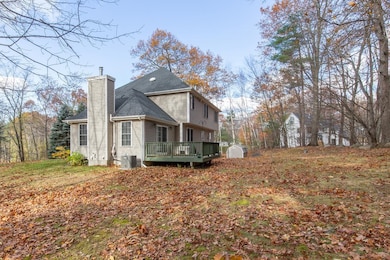
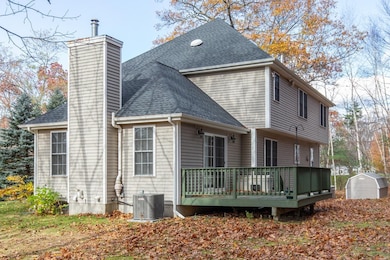
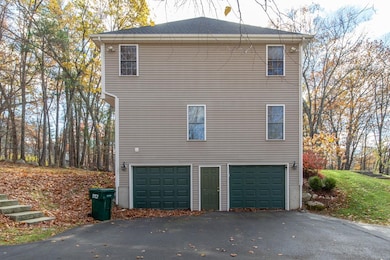
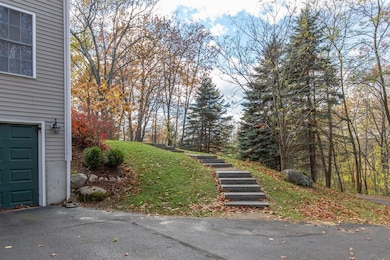
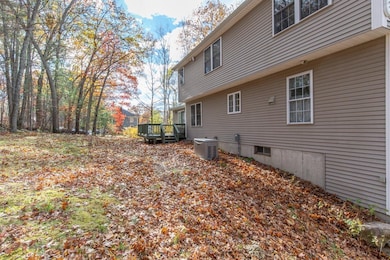
This spacious South Merrimack 4 bedroom, 2 1/2 bath Colonial is set on .91 acres in a lovely private neighborhood setting that overlooks Horse Hill Nature Preserve. Conveniently located close to highway access, Concord Coach Line terminal, Merrimack Outlet Shops, local restaurants, Currier Orchards, Wasserman Park & the YMCA Camp Sargent. Follow the gorgeous granite walkway and step inside to large foyer, beautiful hardwood floors, 1st floor laundry, formal dining room, living room/office, cathedral ceilings, large open concept eat-in kitchen and family room with gas fireplace with beautiful hearth and sliders that open out to wood deck and lovely yard. On the 2nd floor you'll find the amazing Primary Suite with tray ceiling and fan, custom stained glass light fixture, large walk-in closet, full bath with jetted tub, separate shower, dual sinks and water closet. The 3 additional bedrooms all have wall to wall carpeting and spacious closets. The finished lower level is perfect for bonus room, gym or large office and also has additional storage space. . The 2-car garage under has new insulated garage doors which you'll appreciate this Winter. Newly updated this year is the architectural shingled roof, chimney cap and A/C condenser unit. Large shed, Central A/C, underground utilities and whole house generator are other quality features. Easy to show and a quick closing is possible so you can enjoy your Holidays in this beautiful home! Showings begin at 12pm on 11/15/25
Home Details
Home Type
- Single Family
Est. Annual Taxes
- $10,563
Year Built
- Built in 2000
Lot Details
- 0.9 Acre Lot
- Level Lot
Parking
- 2 Car Direct Access Garage
- Driveway
Home Design
- Colonial Architecture
- Wood Frame Construction
- Vinyl Siding
- Radon Mitigation System
Interior Spaces
- Property has 2 Levels
- Woodwork
- Cathedral Ceiling
- Ceiling Fan
- Fireplace
- Natural Light
- Blinds
- Drapes & Rods
- Window Screens
- Entrance Foyer
- Dining Room
- Recreation Room
- Home Security System
Kitchen
- Microwave
- Freezer
- Dishwasher
- Kitchen Island
- Trash Compactor
Flooring
- Wood
- Carpet
- Vinyl
Bedrooms and Bathrooms
- 4 Bedrooms
- En-Suite Bathroom
- Walk-In Closet
- Whirlpool Bathtub
Laundry
- Laundry Room
- Dryer
- Washer
Finished Basement
- Basement Fills Entire Space Under The House
- Interior Basement Entry
Outdoor Features
- Deck
- Shed
Schools
- Thorntons Ferry Elementary School
Utilities
- Central Air
- Underground Utilities
- Leach Field
Listing and Financial Details
- Legal Lot and Block 19 / B188
- Assessor Parcel Number 3
Map
Home Values in the Area
Average Home Value in this Area
Tax History
| Year | Tax Paid | Tax Assessment Tax Assessment Total Assessment is a certain percentage of the fair market value that is determined by local assessors to be the total taxable value of land and additions on the property. | Land | Improvement |
|---|---|---|---|---|
| 2024 | $9,968 | $481,800 | $203,400 | $278,400 |
| 2023 | $9,371 | $481,800 | $203,400 | $278,400 |
| 2022 | $8,242 | $474,200 | $203,400 | $270,800 |
| 2021 | $8,142 | $474,200 | $203,400 | $270,800 |
| 2020 | $8,467 | $351,900 | $142,500 | $209,400 |
| 2019 | $8,491 | $351,900 | $142,500 | $209,400 |
| 2018 | $8,330 | $351,900 | $142,500 | $209,400 |
| 2017 | $8,224 | $351,900 | $142,500 | $209,400 |
| 2016 | $8,020 | $351,900 | $142,500 | $209,400 |
| 2015 | $7,841 | $317,200 | $121,300 | $195,900 |
| 2014 | $7,641 | $317,200 | $121,300 | $195,900 |
| 2013 | $7,477 | $312,700 | $121,300 | $191,400 |
Property History
| Date | Event | Price | List to Sale | Price per Sq Ft |
|---|---|---|---|---|
| 11/08/2025 11/08/25 | For Sale | $784,900 | -- | $264 / Sq Ft |
Purchase History
| Date | Type | Sale Price | Title Company |
|---|---|---|---|
| Fiduciary Deed | -- | None Available | |
| Fiduciary Deed | -- | None Available | |
| Warranty Deed | -- | -- | |
| Warranty Deed | -- | -- | |
| Warranty Deed | $386,000 | -- | |
| Warranty Deed | $386,000 | -- | |
| Warranty Deed | $386,000 | -- | |
| Warranty Deed | $302,500 | -- | |
| Warranty Deed | $302,500 | -- |
Mortgage History
| Date | Status | Loan Amount | Loan Type |
|---|---|---|---|
| Previous Owner | $179,256 | Unknown | |
| Previous Owner | $80,000 | Unknown | |
| Previous Owner | $188,000 | Unknown |
Source: PrimeMLS
MLS Number: 5068982
APN: MRMK-000003B-000188
Disclaimer: Certain information contained herein is derived from information provided by parties other than Homes.com. All information provided is deemed reliable, but is not guaranteed to be accurate and should be independently verified.
![]() Copyright 2025 PrimeMLS, Inc. All rights reserved. This information is deemed reliable, but not guaranteed. The data relating to real estate displayed on this display comes in part from the IDX Program of PrimeMLS. The information being provided is for consumers’ personal, non-commercial use and may not be used for any purpose other than to identify prospective properties consumers may be interested in purchasing.
Copyright 2025 PrimeMLS, Inc. All rights reserved. This information is deemed reliable, but not guaranteed. The data relating to real estate displayed on this display comes in part from the IDX Program of PrimeMLS. The information being provided is for consumers’ personal, non-commercial use and may not be used for any purpose other than to identify prospective properties consumers may be interested in purchasing.
- 80 Peaslee Rd
- 4 Pollard Rd
- 6 Mason Rd
- 9 Cambridge Dr
- 103 Seaverns Bridge Rd
- 105 Seaverns Bridge Rd
- 101-2 Seaverns Bridge Rd
- 1 County Rd
- 27 Sarah Dr
- 66 Tinker Rd
- 5 Jade Rd
- 2 New Haven Dr Unit E303
- 3 Roedean Dr Unit C-207
- 218 Millwright Dr Unit 218
- 201 Millwright Dr
- 1 Longwood Ln
- 40 Turkey Hill Rd
- 5 Blackstone Dr Unit 4
- 5 Lynn Dr
- 77 E Ridge Rd
- 19 Mason Rd
- 3 Lexington Ct
- 29 Cramer Hill Rd
- 2 New Haven Dr Unit 303
- 4 Roedean Dr Unit 306
- 1 Vanderbilt Dr
- 2 Executive Park Dr
- 2 Roedean Dr Unit 303
- 246 Daniel Webster Hwy
- 360 Daniel Webster Hwy
- 17 Powderhouse Rd
- 40 Squire Dr
- 16 High Bridge Hill Unit U175
- 6 Dutch Dr
- 14 Veterans Rd
- 24 Kessler Farm Dr
- 1 Innovation Way
- 1 Innovation Way Unit 103
- 19A Loop Rd
- 185 Indian Rock Rd
