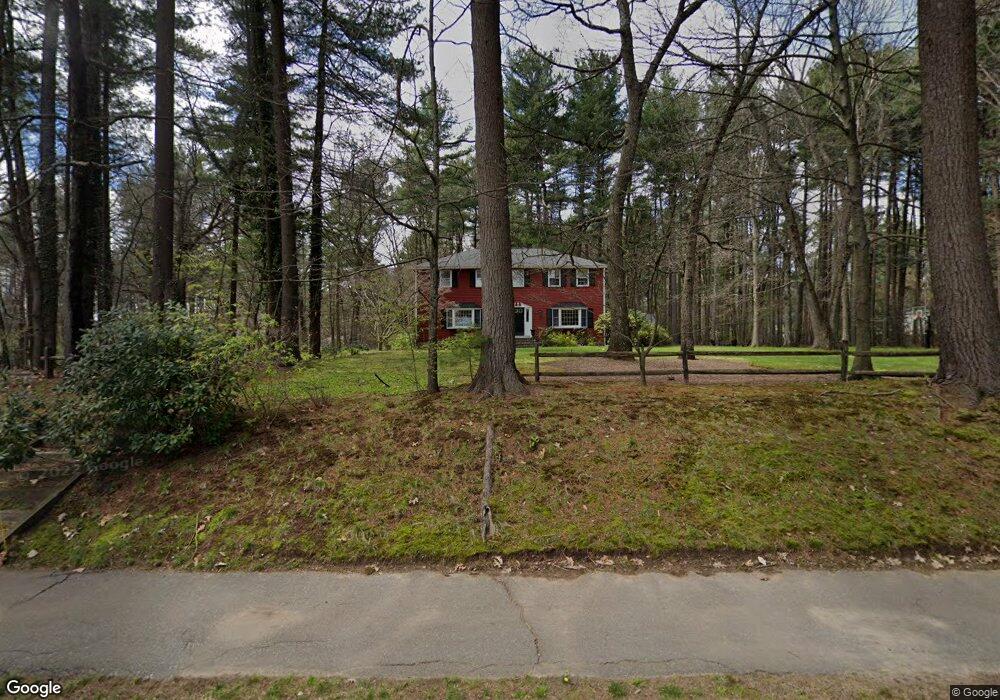
11 Rambling Rd Sudbury, MA 01776
Estimated Value: $1,007,000 - $1,325,000
5
Beds
3
Baths
2,308
Sq Ft
$511/Sq Ft
Est. Value
About This Home
This home is located at 11 Rambling Rd, Sudbury, MA 01776 and is currently estimated at $1,179,577, approximately $511 per square foot. 11 Rambling Rd is a home located in Middlesex County with nearby schools including Israel Loring Elementary School, Ephraim Curtis Middle School, and Lincoln-Sudbury Regional High School.
Ownership History
Date
Name
Owned For
Owner Type
Purchase Details
Closed on
May 5, 2025
Sold by
Kateman Mildred L and Kateman Jonathan B
Bought by
Jonathan B Kateman T B and Jonathan Kateman
Current Estimated Value
Purchase Details
Closed on
Jun 29, 2005
Sold by
Crowley Donald J and Crowley Shelley B
Bought by
Kateman Jonathan B and Kateman Mildred L
Home Financials for this Owner
Home Financials are based on the most recent Mortgage that was taken out on this home.
Original Mortgage
$640,000
Interest Rate
5.73%
Mortgage Type
Purchase Money Mortgage
Create a Home Valuation Report for This Property
The Home Valuation Report is an in-depth analysis detailing your home's value as well as a comparison with similar homes in the area
Home Values in the Area
Average Home Value in this Area
Purchase History
| Date | Buyer | Sale Price | Title Company |
|---|---|---|---|
| Jonathan B Kateman T B | -- | None Available | |
| Jonathan B Kateman T B | -- | None Available | |
| Kateman Jonathan B | $801,000 | -- | |
| Kateman Jonathan B | $801,000 | -- |
Source: Public Records
Mortgage History
| Date | Status | Borrower | Loan Amount |
|---|---|---|---|
| Previous Owner | Kateman Jonathan B | $640,000 | |
| Previous Owner | Kateman Jonathan B | $240,000 |
Source: Public Records
Tax History Compared to Growth
Tax History
| Year | Tax Paid | Tax Assessment Tax Assessment Total Assessment is a certain percentage of the fair market value that is determined by local assessors to be the total taxable value of land and additions on the property. | Land | Improvement |
|---|---|---|---|---|
| 2025 | $15,073 | $1,029,600 | $501,400 | $528,200 |
| 2024 | $14,535 | $994,900 | $487,000 | $507,900 |
| 2023 | $13,572 | $860,600 | $435,000 | $425,600 |
| 2022 | $13,442 | $744,700 | $399,000 | $345,700 |
| 2021 | $12,976 | $689,100 | $399,000 | $290,100 |
| 2020 | $12,714 | $689,100 | $399,000 | $290,100 |
| 2019 | $12,342 | $689,100 | $399,000 | $290,100 |
| 2018 | $12,363 | $689,500 | $424,600 | $264,900 |
| 2017 | $12,124 | $683,400 | $421,000 | $262,400 |
| 2016 | $11,744 | $659,800 | $405,000 | $254,800 |
| 2015 | $11,320 | $643,200 | $393,400 | $249,800 |
| 2014 | $11,296 | $626,500 | $381,800 | $244,700 |
Source: Public Records
Map
Nearby Homes
- 84 Hopestill Brown Rd
- 14 Eisenhower Rd
- 0 Wagonwheel Rd
- 91 Eaton Rd W
- 19 Nob Hill Dr
- 27 Sloane Dr
- 63 Landham Rd
- 32 Eaton Rd W
- 30 Edith Rd
- 128 Nobscot Rd
- 30 Nobscot Rd Unit 14
- 53 Davidson Rd
- 40 Gregory Rd
- 41 James St
- 14 Francine Rd
- 216 Landham Rd
- 8 Clara Rd
- 78 Apple d or Rd
- 106 Baldwin Ave
- 1011 Boston Post Rd