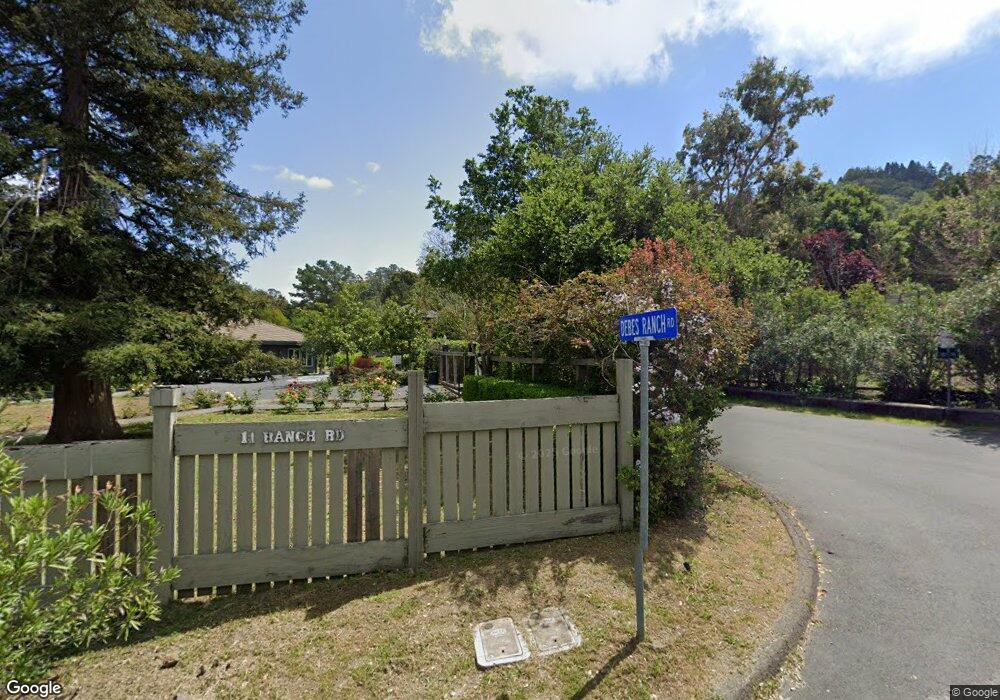
11 Ranch Rd San Rafael, CA 94903
Los Ranchitos NeighborhoodEstimated Value: $2,427,000 - $3,523,000
5
Beds
6
Baths
4,727
Sq Ft
$622/Sq Ft
Est. Value
About This Home
This home is located at 11 Ranch Rd, San Rafael, CA 94903 and is currently estimated at $2,942,233, approximately $622 per square foot. 11 Ranch Rd is a home located in Marin County with nearby schools including Vallecito Elementary School, Miller Creek Middle School, and Terra Linda High School.
Ownership History
Date
Name
Owned For
Owner Type
Purchase Details
Closed on
Mar 29, 2022
Sold by
Baluda Marc C
Bought by
Marc Baluda Living Trust and Baluda
Current Estimated Value
Purchase Details
Closed on
Feb 12, 2020
Sold by
Baluda Marc R and Baluda Marc Richard
Bought by
Baluda Marc R
Home Financials for this Owner
Home Financials are based on the most recent Mortgage that was taken out on this home.
Original Mortgage
$1,892,267
Interest Rate
3.6%
Mortgage Type
New Conventional
Purchase Details
Closed on
Jul 22, 2016
Sold by
Salyer Mary Elizabeth
Bought by
Baluda Marc Richard
Purchase Details
Closed on
Jun 23, 2010
Sold by
Kunst Evelyn M
Bought by
Baluda Marc R and Salyer Mary E
Home Financials for this Owner
Home Financials are based on the most recent Mortgage that was taken out on this home.
Original Mortgage
$485,600
Interest Rate
5.5%
Mortgage Type
New Conventional
Purchase Details
Closed on
Sep 8, 2009
Sold by
Kunst Douglas M
Bought by
Kunst Evelyn M
Purchase Details
Closed on
Aug 11, 2009
Sold by
Kunst Evelyn M
Bought by
Kunst Evelyn M
Purchase Details
Closed on
Jan 5, 2004
Sold by
Kunst John R and Kunst Evelyn M
Bought by
Kunst John R and Kunst Evelyn M
Purchase Details
Closed on
Sep 25, 2003
Sold by
Kunst John R and Kunst Evelyn N
Bought by
Kunst John R and Kunst Evelyn M
Purchase Details
Closed on
Feb 13, 2003
Sold by
Kunst John R and Kunst Evelyn M
Bought by
Kunst John R and Kunst Evelyn M
Home Financials for this Owner
Home Financials are based on the most recent Mortgage that was taken out on this home.
Original Mortgage
$850,000
Interest Rate
6.5%
Purchase Details
Closed on
Jan 28, 2003
Sold by
Kunst John R and Kunst Evelyn M
Bought by
Kunst John R and Kunst Evelyn M
Home Financials for this Owner
Home Financials are based on the most recent Mortgage that was taken out on this home.
Original Mortgage
$850,000
Interest Rate
6.5%
Purchase Details
Closed on
Oct 7, 2002
Sold by
Kunst John R and Kunst Evelyn M
Bought by
Kunst John R and Kunst Evelyn M
Purchase Details
Closed on
Sep 23, 2002
Sold by
All Real Property Inc
Bought by
Kunst John R and Kunst Evelyn M
Purchase Details
Closed on
Apr 8, 2002
Sold by
Chang Cheng I and Chang Jeany
Bought by
All Real Property Inc
Purchase Details
Closed on
Jun 8, 1994
Sold by
Shiraishi Eric S and Shiraishi Diane M
Bought by
Chang Cheng I and Chang Jeany
Create a Home Valuation Report for This Property
The Home Valuation Report is an in-depth analysis detailing your home's value as well as a comparison with similar homes in the area
Home Values in the Area
Average Home Value in this Area
Purchase History
| Date | Buyer | Sale Price | Title Company |
|---|---|---|---|
| Marc Baluda Living Trust | -- | None Listed On Document | |
| Baluda Marc R | -- | Ticor Ttl Orange Cnty Branch | |
| Baluda Marc Richard | -- | None Available | |
| Baluda Marc R | $1,267,000 | Old Republic Title Company | |
| Kunst Evelyn M | -- | None Available | |
| Kunst Douglas M | -- | None Available | |
| Kunst Evelyn M | -- | None Available | |
| Kunst Evelyn M | -- | None Available | |
| Kunst Vincent W | -- | None Available | |
| Kunst Evelyn M | -- | None Available | |
| Kunst Nicholas | -- | None Available | |
| Kunst John R | -- | -- | |
| Kunst John R | -- | -- | |
| Kunst John R | -- | Old Republic Title Company | |
| Kunst John R | -- | -- | |
| Kunst John R | $283,500 | Old Republic Title Company | |
| Kunst John R | $429,000 | Old Republic Title Co | |
| Kunst John R | -- | -- | |
| All Real Property Inc | $1,300,000 | Old Republic Title Company | |
| Chang Cheng I | $761,500 | -- |
Source: Public Records
Mortgage History
| Date | Status | Borrower | Loan Amount |
|---|---|---|---|
| Previous Owner | Baluda Marc R | $1,892,267 | |
| Previous Owner | Baluda Marc R | $485,600 | |
| Previous Owner | Kunst John R | $850,000 |
Source: Public Records
Tax History
| Year | Tax Paid | Tax Assessment Tax Assessment Total Assessment is a certain percentage of the fair market value that is determined by local assessors to be the total taxable value of land and additions on the property. | Land | Improvement |
|---|---|---|---|---|
| 2025 | $21,604 | $1,628,900 | $1,097,120 | $531,780 |
| 2024 | $21,006 | $1,596,972 | $1,075,615 | $521,357 |
| 2023 | $21,003 | $1,565,662 | $1,054,527 | $511,135 |
| 2022 | $20,182 | $1,534,970 | $1,033,855 | $501,115 |
| 2021 | $19,269 | $1,504,884 | $1,013,591 | $491,293 |
| 2020 | $19,307 | $1,489,462 | $1,003,204 | $486,258 |
| 2019 | $18,440 | $1,460,260 | $983,535 | $476,725 |
| 2018 | $18,230 | $1,431,638 | $964,257 | $467,381 |
| 2017 | $17,218 | $1,403,571 | $945,353 | $458,218 |
| 2016 | $16,865 | $1,376,059 | $926,823 | $449,236 |
| 2015 | $16,476 | $1,355,400 | $912,908 | $442,492 |
| 2014 | $15,420 | $1,328,860 | $895,033 | $433,827 |
Source: Public Records
Map
Nearby Homes
- 8 Circle Rd
- 91 Almond Ct
- 29 Red Rock Way
- 31 Red Rock Way
- 21 Red Rock Way
- 260 Merrydale Rd Unit 5
- 260 Merrydale Rd Unit 14
- 311 Las Flores Ave
- 87 Oakmont Ave
- 0 Fair Dr Unit 325072555
- 59 Fair Dr
- 46 Laurel Glen Terrace
- 14 Summerhill Ct
- 92 Elizabeth Way
- 30 Fair Dr
- 32 Picadilly Ct
- 68 Village Cir
- 280 Prospect Dr
- 250 Prospect Dr
- 0 Coleman Dr Unit 326011947
Your Personal Tour Guide
Ask me questions while you tour the home.