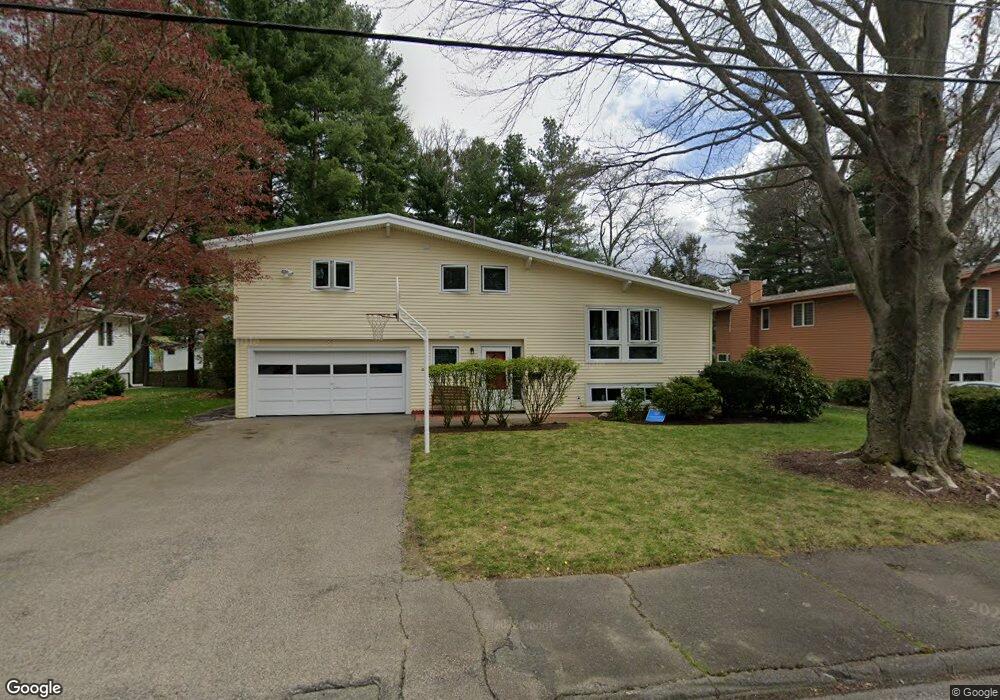
11 Randy Rd Framingham, MA 01701
Estimated Value: $681,000 - $964,000
3
Beds
3
Baths
1,390
Sq Ft
$557/Sq Ft
Est. Value
About This Home
This home is located at 11 Randy Rd, Framingham, MA 01701 and is currently estimated at $774,161, approximately $556 per square foot. 11 Randy Rd is a home located in Middlesex County with nearby schools including Framingham High School, Christa McAuliffe Charter School, and Happy Hollow School.
Ownership History
Date
Name
Owned For
Owner Type
Purchase Details
Closed on
Sep 1, 1989
Sold by
Weiss Jonathan B
Bought by
Geller Alan C
Current Estimated Value
Home Financials for this Owner
Home Financials are based on the most recent Mortgage that was taken out on this home.
Original Mortgage
$32,500
Interest Rate
9.7%
Mortgage Type
Purchase Money Mortgage
Create a Home Valuation Report for This Property
The Home Valuation Report is an in-depth analysis detailing your home's value as well as a comparison with similar homes in the area
Home Values in the Area
Average Home Value in this Area
Purchase History
| Date | Buyer | Sale Price | Title Company |
|---|---|---|---|
| Geller Alan C | $207,500 | -- | |
| Geller Alan C | $207,500 | -- |
Source: Public Records
Mortgage History
| Date | Status | Borrower | Loan Amount |
|---|---|---|---|
| Closed | Geller Alan C | $47,500 | |
| Closed | Geller Alan C | $50,000 | |
| Closed | Geller Alan C | $32,500 |
Source: Public Records
Tax History Compared to Growth
Tax History
| Year | Tax Paid | Tax Assessment Tax Assessment Total Assessment is a certain percentage of the fair market value that is determined by local assessors to be the total taxable value of land and additions on the property. | Land | Improvement |
|---|---|---|---|---|
| 2025 | $7,852 | $657,600 | $260,800 | $396,800 |
| 2024 | $7,455 | $598,300 | $232,900 | $365,400 |
| 2023 | $7,033 | $537,300 | $207,800 | $329,500 |
| 2022 | $6,641 | $483,300 | $188,600 | $294,700 |
| 2021 | $6,508 | $463,200 | $181,300 | $281,900 |
| 2020 | $6,660 | $444,600 | $164,700 | $279,900 |
| 2019 | $6,590 | $428,500 | $164,700 | $263,800 |
| 2018 | $6,520 | $399,500 | $158,600 | $240,900 |
| 2017 | $6,290 | $376,400 | $154,000 | $222,400 |
| 2016 | $6,238 | $358,900 | $154,000 | $204,900 |
| 2015 | $5,865 | $329,100 | $154,200 | $174,900 |
Source: Public Records
Map
Nearby Homes
- 8 Emily Rd
- 30 Donlon St
- 11 Longview Rd
- 27 Joclyn Ave
- 447 Old Connecticut Path
- 144 Old Connecticut Path
- 177 Summer St
- 30 Morse Rd
- 92 Old Connecticut Path
- 194 Beacon St
- 145 Beacon St
- 689 Old Connecticut Path
- 15 Haynes Rd
- 12 Bryant Rd
- 8 Old Conn Path
- 17 Laclede Ave
- 52 Lohnes Rd
- 33 Highgate Rd
- 109 Hastings St
- 29 Aberdeen Rd