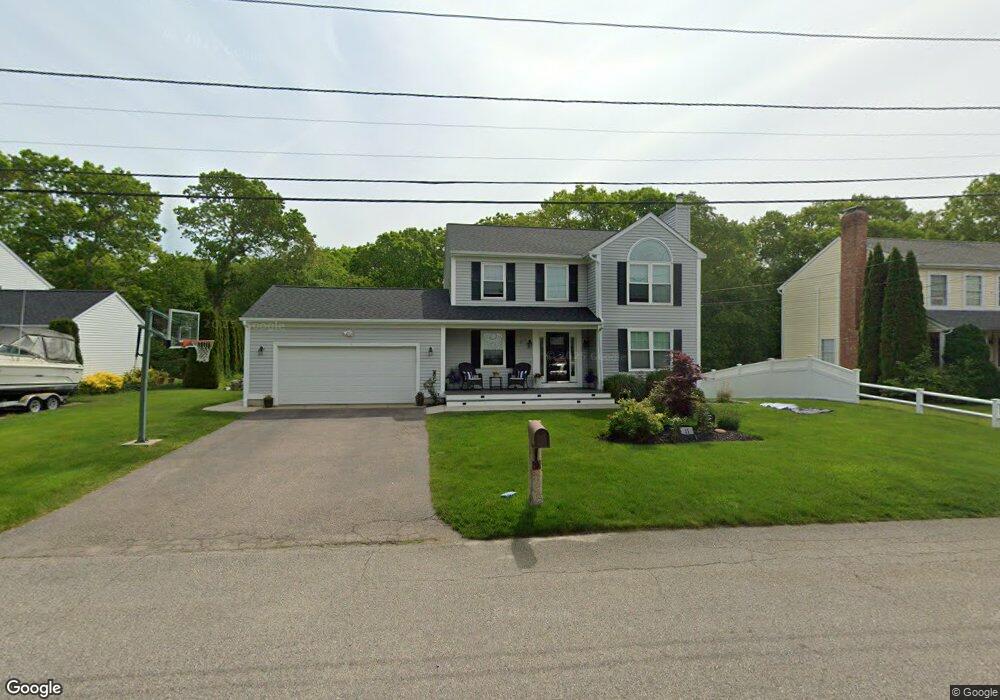
11 Red Brook Dr Westerly, RI 02891
Estimated Value: $654,852 - $815,000
3
Beds
3
Baths
1,692
Sq Ft
$441/Sq Ft
Est. Value
About This Home
This home is located at 11 Red Brook Dr, Westerly, RI 02891 and is currently estimated at $745,463, approximately $440 per square foot. 11 Red Brook Dr is a home located in Washington County with nearby schools including Westerly High School and St. Michael School.
Ownership History
Date
Name
Owned For
Owner Type
Purchase Details
Closed on
Oct 29, 2007
Sold by
Sirva Relocation Llc
Bought by
Campbell James P and Campbell Rosaria V
Current Estimated Value
Purchase Details
Closed on
Nov 20, 2001
Sold by
Difabio Anthony F
Bought by
Mcclain Ann
Purchase Details
Closed on
Jan 20, 1999
Sold by
Nema Ent Inc and Celico Robert A
Bought by
Difabio Anthony F and Difabio Lori A
Purchase Details
Closed on
Sep 1, 1998
Sold by
Nema Enterprises Inc
Bought by
Yuen Chi Keung and Yuen Mo Ching
Create a Home Valuation Report for This Property
The Home Valuation Report is an in-depth analysis detailing your home's value as well as a comparison with similar homes in the area
Home Values in the Area
Average Home Value in this Area
Purchase History
| Date | Buyer | Sale Price | Title Company |
|---|---|---|---|
| Campbell James P | $355,000 | -- | |
| Sirva Relocation Llc | $40,000 | -- | |
| Mcclain Ann | $240,000 | -- | |
| Difabio Anthony F | $180,000 | -- | |
| Yuen Chi Keung | $161,000 | -- |
Source: Public Records
Mortgage History
| Date | Status | Borrower | Loan Amount |
|---|---|---|---|
| Open | Yuen Chi Keung | $296,000 | |
| Closed | Yuen Chi Keung | $334,444 |
Source: Public Records
Tax History
| Year | Tax Paid | Tax Assessment Tax Assessment Total Assessment is a certain percentage of the fair market value that is determined by local assessors to be the total taxable value of land and additions on the property. | Land | Improvement |
|---|---|---|---|---|
| 2025 | $3,925 | $552,100 | $216,400 | $335,700 |
| 2024 | $4,098 | $417,700 | $154,600 | $263,100 |
| 2023 | $4,018 | $417,700 | $154,600 | $263,100 |
| 2022 | $3,993 | $417,700 | $154,600 | $263,100 |
| 2021 | $4,019 | $348,900 | $134,400 | $214,500 |
| 2020 | $3,946 | $348,900 | $134,400 | $214,500 |
| 2019 | $3,908 | $348,900 | $134,400 | $214,500 |
| 2018 | $3,632 | $305,700 | $124,100 | $181,600 |
| 2017 | $3,543 | $305,700 | $124,100 | $181,600 |
| 2016 | $3,571 | $305,700 | $124,100 | $181,600 |
| 2015 | $3,470 | $320,700 | $137,200 | $183,500 |
| 2014 | $3,412 | $320,700 | $137,200 | $183,500 |
Source: Public Records
Map
Nearby Homes
- 18 Timothy Dr
- 33 Whipple Ave
- 24 Abbey Ln Unit 13
- 23 Abbey Ln Unit 12
- 9 Crestview Dr Unit C
- 19 Wicklow Rd
- 9 Compass Way Unit 201
- 9 Compass Way Unit 202
- 9 Compass Way Unit 101
- 9 Compass Way Unit 102
- 9 Compass Way Unit 103
- 9 Compass Way Unit 203
- 54 Sherwood Dr
- 10 Tristam St
- 22 Summertime Cir
- 23 Summertime Cir
- 14 Summertime Cir
- 45 Summertime Cir
- 38 Summertime Cir
- 39 Summertime Cir
Your Personal Tour Guide
Ask me questions while you tour the home.