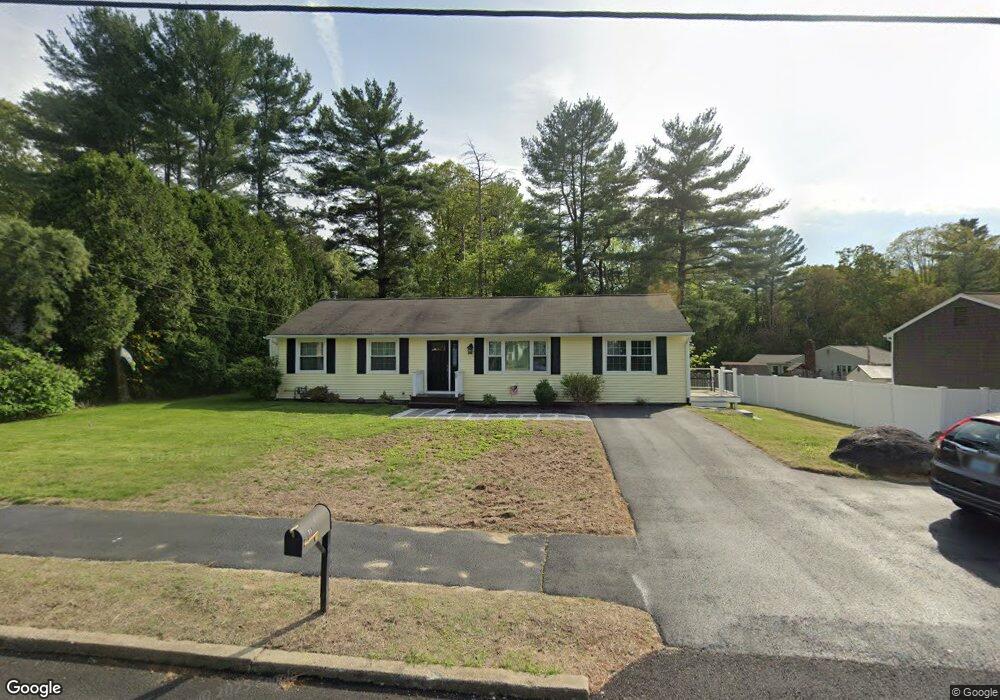
11 Red Oak Dr Coventry, RI 02816
Estimated Value: $418,548 - $496,000
3
Beds
1
Bath
1,500
Sq Ft
$307/Sq Ft
Est. Value
About This Home
This home is located at 11 Red Oak Dr, Coventry, RI 02816 and is currently estimated at $461,137, approximately $307 per square foot. 11 Red Oak Dr is a home located in Kent County with nearby schools including Alan Shawn Feinstein Ms Of Cov, Coventry High School, and Father John V. Doyle School.
Ownership History
Date
Name
Owned For
Owner Type
Purchase Details
Closed on
Aug 28, 1998
Sold by
M D P Assoc
Bought by
Samuell Joseph M and Samuell Deborah S
Current Estimated Value
Home Financials for this Owner
Home Financials are based on the most recent Mortgage that was taken out on this home.
Original Mortgage
$97,665
Interest Rate
6.9%
Purchase Details
Closed on
Jan 9, 1998
Sold by
Webster Bank
Bought by
Mdp Assoc Llc
Create a Home Valuation Report for This Property
The Home Valuation Report is an in-depth analysis detailing your home's value as well as a comparison with similar homes in the area
Purchase History
We collect this data history from publicly available records. To have your information removed, we recommend requesting removal directly through your county’s website.
| Date | Buyer | Sale Price | Title Company |
|---|---|---|---|
| Samuell Joseph M | $115,000 | -- | |
| Mdp Assoc Llc | $94,000 | -- |
Source: Public Records
Mortgage History
We collect this data history from publicly available records. To have your information removed, we recommend requesting removal directly through your county’s website.
| Date | Status | Borrower | Loan Amount |
|---|---|---|---|
| Open | Mdp Assoc Llc | $139,081 | |
| Closed | Mdp Assoc Llc | $25,000 | |
| Closed | Mdp Assoc Llc | $108,200 | |
| Closed | Mdp Assoc Llc | $97,665 |
Source: Public Records
Tax History
| Year | Tax Paid | Tax Assessment Tax Assessment Total Assessment is a certain percentage of the fair market value that is determined by local assessors to be the total taxable value of land and additions on the property. | Land | Improvement |
|---|---|---|---|---|
| 2025 | $5,640 | $350,500 | $125,100 | $225,400 |
| 2024 | $5,630 | $355,400 | $125,100 | $230,300 |
| 2023 | $5,448 | $355,400 | $125,100 | $230,300 |
| 2022 | $4,865 | $248,600 | $110,400 | $138,200 |
| 2021 | $4,823 | $248,600 | $110,400 | $138,200 |
| 2020 | $5,529 | $248,600 | $110,400 | $138,200 |
| 2019 | $4,415 | $198,500 | $76,900 | $121,600 |
| 2018 | $4,290 | $198,500 | $76,900 | $121,600 |
| 2017 | $4,165 | $198,500 | $76,900 | $121,600 |
| 2016 | $4,344 | $202,900 | $93,700 | $109,200 |
| 2015 | $4,226 | $202,900 | $93,700 | $109,200 |
| 2014 | $4,138 | $202,900 | $93,700 | $109,200 |
| 2013 | $4,240 | $227,200 | $98,900 | $128,300 |
Source: Public Records
Map
Nearby Homes
- 0 Chase Rd Unit 1365354
- 16 Hope Furnace Rd
- 1 Pierce St
- 0 Main St Unit 1412302
- 295 Main St
- 47 Howard Ave
- 23 Moss Ln
- 87 Hall Ln
- 24 Lincoln Ave
- 35 Mumford St
- 22 Harris St Unit 24
- 15 Laforge Dr
- 2 Sandalwood Ct
- 251 North Rd
- 67 Remington Farm Dr
- 57 Hunters Crossing Dr
- 78 Gervais St
- 235 Lippitt Ave
- 0 Bee St
- 0 Hoxie Ct
Your Personal Tour Guide
Ask me questions while you tour the home.