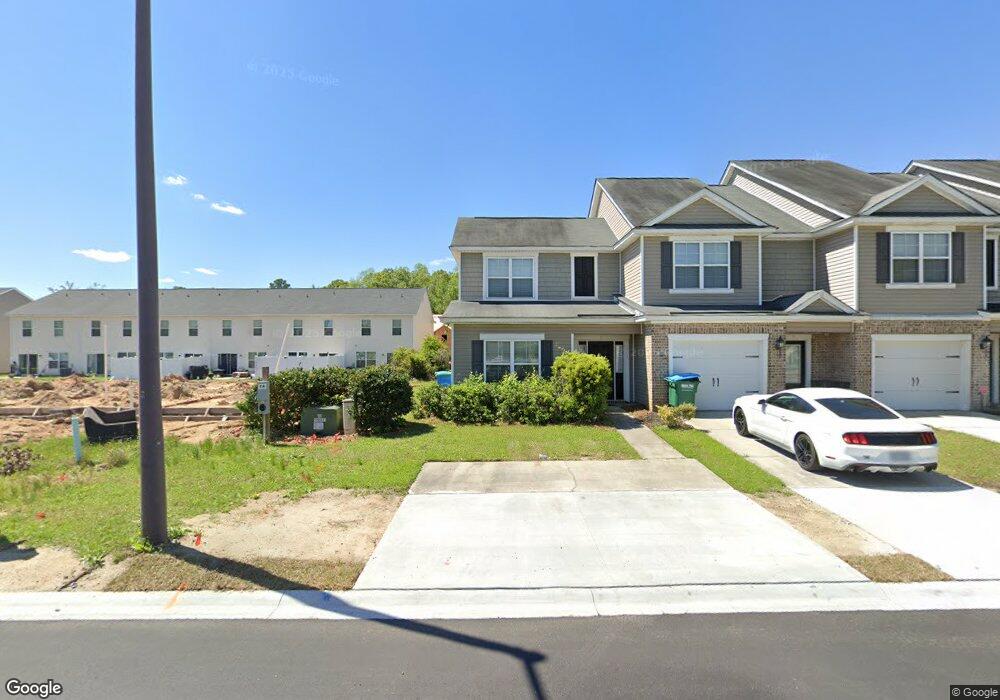
11 Red Robin Ct Savannah, GA 31407
Estimated Value: $210,000 - $248,000
1
Bed
2
Baths
1,189
Sq Ft
$193/Sq Ft
Est. Value
About This Home
This home is located at 11 Red Robin Ct, Savannah, GA 31407 and is currently estimated at $229,930, approximately $193 per square foot. 11 Red Robin Ct is a home located in Chatham County with nearby schools including Rice Creek K-8 School, Groves High School, and Savannah Adventist Christian School.
Ownership History
Date
Name
Owned For
Owner Type
Purchase Details
Closed on
May 30, 2017
Bought by
Aoude Alfred
Current Estimated Value
Purchase Details
Closed on
Mar 7, 2017
Sold by
Stringer Quanda N
Bought by
Quicken Loans Inc
Purchase Details
Closed on
Jun 24, 2008
Sold by
Not Provided
Bought by
Stringer Quanda N
Home Financials for this Owner
Home Financials are based on the most recent Mortgage that was taken out on this home.
Original Mortgage
$125,012
Interest Rate
6.08%
Mortgage Type
FHA
Create a Home Valuation Report for This Property
The Home Valuation Report is an in-depth analysis detailing your home's value as well as a comparison with similar homes in the area
Home Values in the Area
Average Home Value in this Area
Purchase History
| Date | Buyer | Sale Price | Title Company |
|---|---|---|---|
| Aoude Alfred | $91,750 | -- | |
| Quicken Loans Inc | $86,240 | -- | |
| Stringer Quanda N | $126,000 | -- |
Source: Public Records
Mortgage History
| Date | Status | Borrower | Loan Amount |
|---|---|---|---|
| Previous Owner | Stringer Quanda N | $125,012 |
Source: Public Records
Tax History Compared to Growth
Tax History
| Year | Tax Paid | Tax Assessment Tax Assessment Total Assessment is a certain percentage of the fair market value that is determined by local assessors to be the total taxable value of land and additions on the property. | Land | Improvement |
|---|---|---|---|---|
| 2025 | $2,385 | $85,120 | $18,000 | $67,120 |
| 2024 | $2,385 | $72,840 | $18,000 | $54,840 |
| 2023 | $2,454 | $75,960 | $18,000 | $57,960 |
| 2022 | $1,255 | $42,400 | $8,000 | $34,400 |
| 2021 | $1,247 | $37,080 | $8,000 | $29,080 |
| 2020 | $1,475 | $36,720 | $8,000 | $28,720 |
| 2019 | $1,475 | $42,640 | $8,000 | $34,640 |
| 2018 | $1,332 | $37,320 | $8,000 | $29,320 |
| 2017 | $1,238 | $37,800 | $8,000 | $29,800 |
| 2016 | $868 | $36,920 | $8,000 | $28,920 |
| 2015 | $756 | $32,880 | $8,000 | $24,880 |
| 2014 | $1,293 | $32,760 | $0 | $0 |
Source: Public Records
Map
Nearby Homes
- 10 Brown Thrasher Ct
- 8 Brown Thrasher Ct
- 31 Red Robin Ct
- 22 Roseberry Cir
- 9 Sunnydale Ln
- 14 Roseberry Cir
- 15 Amber Dr
- 135 Fox Glen Ct
- 133 Fox Glen Ct
- 115 Fox Glen Ct
- 35 Braxton Manor Dr
- 44 Braxton Manor Dr
- 629 & 631 Meinhard Rd
- 1 Blackberry Ln
- 18 Allen Brook Dr
- 430 Punkin Bridge Rd
- 54 Hawkhorn Ct
- 16 Holly Springs Cir
- 6 Falkland Ave
- 136 Basswood Dr Unit 8
- 11 Red Robin Ct
- 9 Red Robin Ct
- 9 Red Robin Ct
- 7 Red Robin Ct
- 13 Red Robin Ct
- 5 Red Robin Ct
- 15 Red Robin Ct
- 3 Red Robin Ct
- 3 Red Robin (Fully Furnished) Ct
- 3 Red Robin (Furnished) Ct
- 3 Red Robin Ct
- 17 Red Robin Ct
- 1 Red Robin Ct
- 12 Brown Thrasher Ct
- 1 Red Robin Ct
- 19 Red Robin Ct
- 14 Brown Thrasher Ct
- 6 Brown Thrasher Ct
- 16 Brown Thrasher Ct
- 18 Brown Thrasher Ct