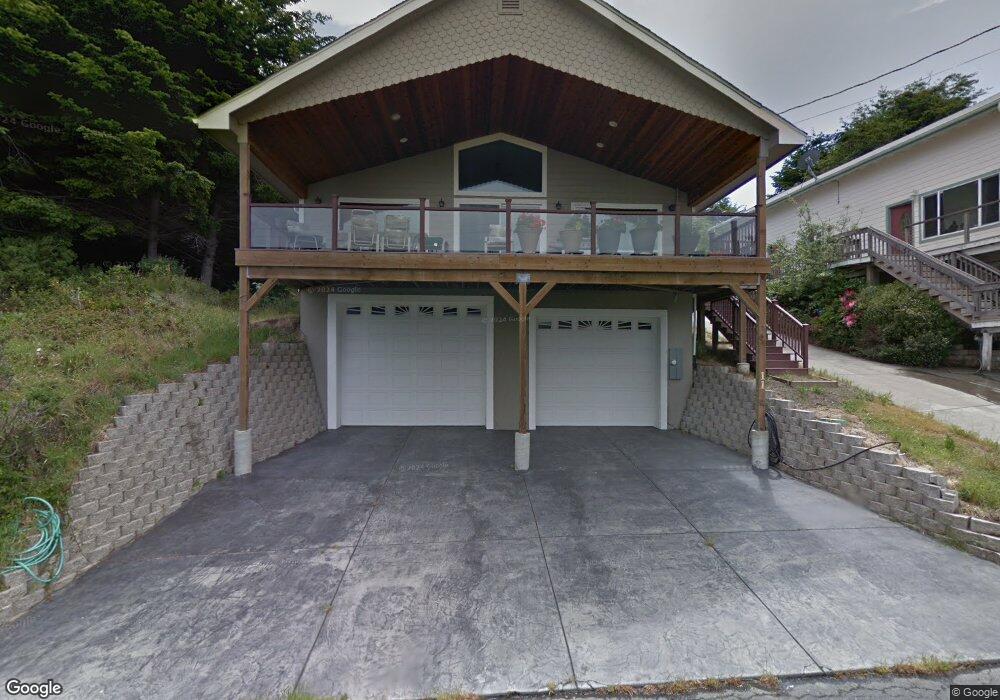
11 Redcrest Ct Whitethorn, CA 95589
Estimated Value: $444,210 - $564,000
Studio
--
Bath
--
Sq Ft
5,968
Sq Ft Lot
About This Home
This home is located at 11 Redcrest Ct, Whitethorn, CA 95589 and is currently estimated at $506,053. 11 Redcrest Ct is a home located in Humboldt County.
Ownership History
Date
Name
Owned For
Owner Type
Purchase Details
Closed on
Nov 9, 2022
Sold by
Freed Family Trust
Bought by
Freed Andrew E and Freed Mary Ellen
Current Estimated Value
Purchase Details
Closed on
Jun 11, 2010
Sold by
Freed Andrew E and Freed Family Trust
Bought by
Freed Andrew E
Home Financials for this Owner
Home Financials are based on the most recent Mortgage that was taken out on this home.
Original Mortgage
$562,500
Interest Rate
4.82%
Mortgage Type
Reverse Mortgage Home Equity Conversion Mortgage
Purchase Details
Closed on
Jul 26, 2004
Sold by
Freed Andrew E and Freed Susan E
Bought by
Freed Andrew E and Freed Susan E
Purchase Details
Closed on
Aug 27, 2001
Sold by
Odessky Natalie E
Bought by
Freed Andy and Freed Susan
Purchase Details
Closed on
Aug 17, 2001
Sold by
Union Bank Of California Na
Bought by
Odessky Natalie E
Create a Home Valuation Report for This Property
The Home Valuation Report is an in-depth analysis detailing your home's value as well as a comparison with similar homes in the area
Home Values in the Area
Average Home Value in this Area
Purchase History
| Date | Buyer | Sale Price | Title Company |
|---|---|---|---|
| Freed Andrew E | -- | North American Title | |
| Freed Andrew E | -- | North American Title Co Inc | |
| Freed Andrew E | -- | -- | |
| Freed Andrew E | -- | -- | |
| Freed Andy | $18,000 | First American Title Ins Co | |
| Odessky Natalie E | -- | First American Title Ins Co |
Source: Public Records
Mortgage History
| Date | Status | Borrower | Loan Amount |
|---|---|---|---|
| Previous Owner | Freed Andrew E | $562,500 |
Source: Public Records
Tax History
| Year | Tax Paid | Tax Assessment Tax Assessment Total Assessment is a certain percentage of the fair market value that is determined by local assessors to be the total taxable value of land and additions on the property. | Land | Improvement |
|---|---|---|---|---|
| 2025 | $4,553 | $409,720 | $26,583 | $383,137 |
| 2024 | $4,553 | $401,687 | $26,062 | $375,625 |
| 2023 | $4,569 | $393,811 | $25,551 | $368,260 |
| 2022 | $4,500 | $386,090 | $25,050 | $361,040 |
| 2021 | $4,335 | $378,520 | $24,559 | $353,961 |
| 2020 | $4,359 | $374,640 | $24,308 | $350,332 |
| 2019 | $4,254 | $367,295 | $23,832 | $343,463 |
| 2018 | $4,182 | $360,094 | $23,365 | $336,729 |
| 2017 | $4,005 | $353,034 | $22,907 | $330,127 |
| 2016 | $3,981 | $346,112 | $22,458 | $323,654 |
| 2015 | $3,960 | $340,914 | $22,121 | $318,793 |
| 2014 | $3,788 | $334,237 | $21,688 | $312,549 |
Source: Public Records
Map
Nearby Homes
Your Personal Tour Guide
Ask me questions while you tour the home.