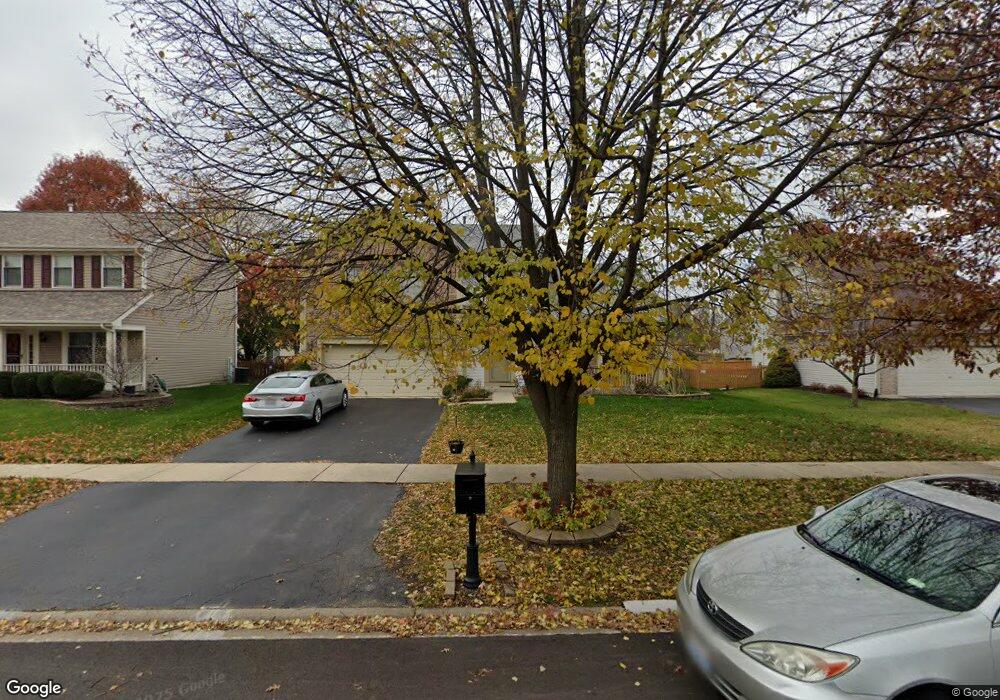
11 Redspire Ct Bolingbrook, IL 60490
East Bolingbrook NeighborhoodEstimated Value: $428,000 - $446,000
4
Beds
3
Baths
2,156
Sq Ft
$203/Sq Ft
Est. Value
About This Home
This home is located at 11 Redspire Ct, Bolingbrook, IL 60490 and is currently estimated at $438,688, approximately $203 per square foot. 11 Redspire Ct is a home located in Will County with nearby schools including Pioneer Elementary School, Brooks Middle School, and Bolingbrook High School.
Ownership History
Date
Name
Owned For
Owner Type
Purchase Details
Closed on
Sep 7, 2007
Sold by
Phatak Sushrut and Phatak Neelaxi
Bought by
Chalasani Tilak V and Chalasani Seeta M
Current Estimated Value
Home Financials for this Owner
Home Financials are based on the most recent Mortgage that was taken out on this home.
Original Mortgage
$299,000
Outstanding Balance
$190,660
Interest Rate
6.71%
Mortgage Type
Purchase Money Mortgage
Estimated Equity
$248,028
Purchase Details
Closed on
Mar 30, 1998
Sold by
Richard Smykal Inc
Bought by
Burke Charles K and Burke Cynthia J
Home Financials for this Owner
Home Financials are based on the most recent Mortgage that was taken out on this home.
Original Mortgage
$172,900
Interest Rate
7.5%
Create a Home Valuation Report for This Property
The Home Valuation Report is an in-depth analysis detailing your home's value as well as a comparison with similar homes in the area
Home Values in the Area
Average Home Value in this Area
Purchase History
| Date | Buyer | Sale Price | Title Company |
|---|---|---|---|
| Chalasani Tilak V | $299,000 | Attorneys Title Guaranty Fun | |
| Burke Charles K | $182,000 | Chicago Title Insurance Co |
Source: Public Records
Mortgage History
| Date | Status | Borrower | Loan Amount |
|---|---|---|---|
| Open | Chalasani Tilak V | $299,000 | |
| Previous Owner | Burke Charles K | $172,900 |
Source: Public Records
Tax History
| Year | Tax Paid | Tax Assessment Tax Assessment Total Assessment is a certain percentage of the fair market value that is determined by local assessors to be the total taxable value of land and additions on the property. | Land | Improvement |
|---|---|---|---|---|
| 2024 | $11,523 | $132,765 | $20,719 | $112,046 |
| 2023 | $11,523 | $119,457 | $18,642 | $100,815 |
| 2022 | $10,052 | $107,697 | $16,807 | $90,890 |
| 2021 | $9,534 | $100,699 | $15,715 | $84,984 |
| 2020 | $9,244 | $97,388 | $15,198 | $82,190 |
| 2019 | $8,950 | $92,750 | $14,474 | $78,276 |
| 2018 | $8,597 | $88,773 | $13,853 | $74,920 |
| 2017 | $8,190 | $84,145 | $13,131 | $71,014 |
| 2016 | $7,958 | $80,100 | $12,500 | $67,600 |
| 2015 | $7,702 | $75,400 | $11,800 | $63,600 |
| 2014 | $7,702 | $75,400 | $11,800 | $63,600 |
| 2013 | $7,702 | $75,400 | $11,800 | $63,600 |
Source: Public Records
Map
Nearby Homes
- 13 Callery Ct
- 301 Inner Circle Dr
- 1156 Partridge Ave
- 358 Thistle Dr
- 1404 Lily Cache Ln
- 452 Pheasant Chase Dr
- 309 Blackfoot Dr
- 1472 Misty Ln Unit 2B
- 1150 Coventry Ln
- 402 S Palmer Dr Unit 2B
- 8 Lily Ct
- 1086 Lily Field Ln
- 154 Grady Dr
- 1450 Shaman Dr
- 333 Claridge Cir
- 164 S Palmer Dr
- 402 Marshall Ash St Unit 3
- 1568 Woodland Ln
- 867 Harris Dr Unit 5
- 1445 Somerfield Dr
Your Personal Tour Guide
Ask me questions while you tour the home.