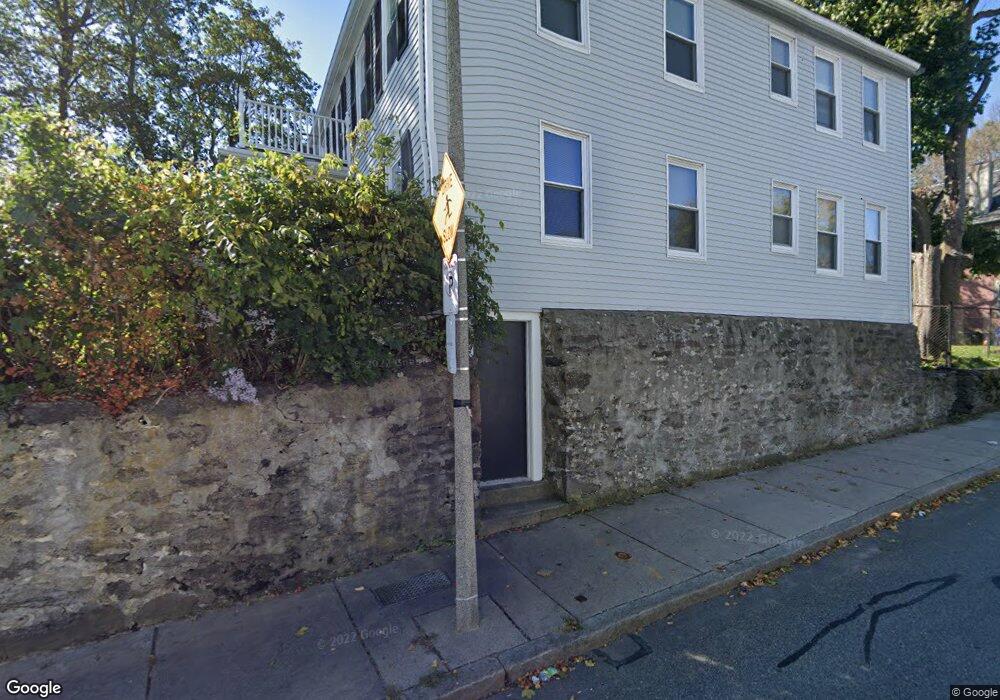
11 Regent St Unit 13 Roxbury, MA 02119
Washington Park NeighborhoodEstimated Value: $942,000 - $1,215,000
4
Beds
2
Baths
2,782
Sq Ft
$375/Sq Ft
Est. Value
About This Home
This home is located at 11 Regent St Unit 13, Roxbury, MA 02119 and is currently estimated at $1,042,378, approximately $374 per square foot. 11 Regent St Unit 13 is a home located in Suffolk County with nearby schools including City on a Hill Charter Public School and Paige Academy.
Ownership History
Date
Name
Owned For
Owner Type
Purchase Details
Closed on
Jul 10, 1997
Sold by
Coleman Iris O
Bought by
Coleman-Woolridge L
Current Estimated Value
Home Financials for this Owner
Home Financials are based on the most recent Mortgage that was taken out on this home.
Original Mortgage
$60,000
Interest Rate
7.86%
Mortgage Type
Purchase Money Mortgage
Create a Home Valuation Report for This Property
The Home Valuation Report is an in-depth analysis detailing your home's value as well as a comparison with similar homes in the area
Home Values in the Area
Average Home Value in this Area
Purchase History
| Date | Buyer | Sale Price | Title Company |
|---|---|---|---|
| Coleman-Woolridge L | $42,000 | -- |
Source: Public Records
Mortgage History
| Date | Status | Borrower | Loan Amount |
|---|---|---|---|
| Open | Coleman-Woolridge L | $60,000 | |
| Closed | Coleman-Woolridge L | $10,796 | |
| Closed | Coleman-Woolridge L | $60,000 |
Source: Public Records
Tax History Compared to Growth
Tax History
| Year | Tax Paid | Tax Assessment Tax Assessment Total Assessment is a certain percentage of the fair market value that is determined by local assessors to be the total taxable value of land and additions on the property. | Land | Improvement |
|---|---|---|---|---|
| 2025 | $10,239 | $884,200 | $384,300 | $499,900 |
| 2024 | $9,446 | $866,600 | $331,200 | $535,400 |
| 2023 | $8,863 | $825,200 | $315,400 | $509,800 |
| 2022 | $8,163 | $750,300 | $286,800 | $463,500 |
| 2021 | $7,481 | $701,100 | $268,000 | $433,100 |
| 2020 | $6,769 | $641,000 | $268,300 | $372,700 |
| 2019 | $6,313 | $599,000 | $199,300 | $399,700 |
| 2018 | $5,869 | $560,000 | $199,300 | $360,700 |
| 2017 | $5,648 | $533,300 | $199,300 | $334,000 |
| 2016 | $5,238 | $476,200 | $199,300 | $276,900 |
| 2015 | $4,413 | $364,400 | $130,500 | $233,900 |
| 2014 | $4,125 | $327,900 | $130,500 | $197,400 |
Source: Public Records
Map
Nearby Homes
- 37 Regent St Unit 2
- 51 Saint James St
- 22 Rockville Park
- 20 Rockville Park
- 91 Zeigler St
- 38 Juniper St
- 10 Taber St Unit 501
- 250 Dudley St Unit 1
- 9 W Cedar St Unit 1
- 30 Copeland St Unit 1
- 2 Mount Pleasant Place Unit 2
- 10 Rockland St Unit 4
- 33 Copeland Park Unit C
- 94 Walnut Ave
- 27 Dudley St
- 101 Mount Pleasant Ave
- 49 Norfolk St
- 7 Langford Park Unit 3
- 108 Mount Pleasant Ave Unit 108R
- 31 Dorr St
- 1 Regent Place
- 17 Regent St Unit 19
- 2 Regent Place
- 14 Saint James St
- 11 Saint James St
- 3 Regent Place
- 7 Saint James St
- 3 Regent Place
- 9 Saint James St Unit 1
- 9 Saint James St Unit 11
- 9 Saint James St Unit 5
- 9 Saint James St Unit 2
- 9 Saint James St Unit 4
- 11 St James St Unit 2
- 11 Saint James Ave Unit 1
- 23 Hansford Place Unit 2
- 4 Regent Place
- 21 Regent St Unit 23
- 16 Saint James St
- 4 Akron Place