Estimated Value: $231,000 - $295,000
2
Beds
1
Bath
550
Sq Ft
$474/Sq Ft
Est. Value
About This Home
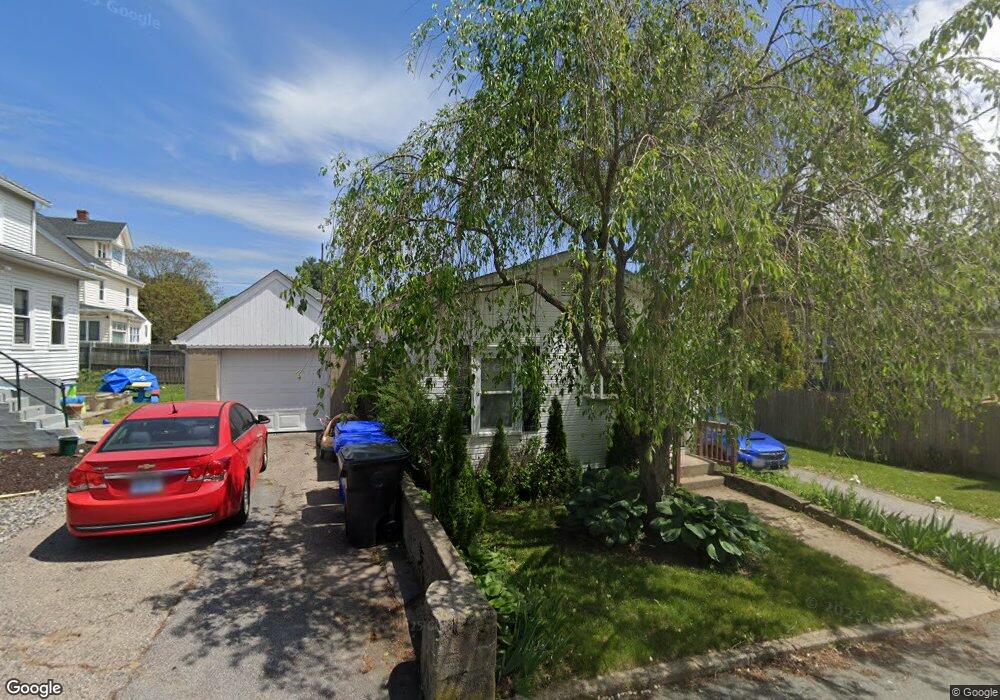
This home is located at 11 Rita St, West Warwick, RI 02893 and is currently estimated at $260,741, approximately $474 per square foot. 11 Rita St is a home located in Kent County with nearby schools including West Warwick High School.
Ownership History
Date
Name
Owned For
Owner Type
Purchase Details
Closed on
Jun 27, 2019
Sold by
Mark Anthony Homes Llc
Bought by
Rocchio Felicia M
Current Estimated Value
Home Financials for this Owner
Home Financials are based on the most recent Mortgage that was taken out on this home.
Original Mortgage
$100,800
Outstanding Balance
$88,634
Interest Rate
4%
Mortgage Type
Purchase Money Mortgage
Estimated Equity
$172,107
Purchase Details
Closed on
May 7, 2018
Sold by
Heon Christopher J
Bought by
Mark Anthony Homes Llc
Purchase Details
Closed on
Oct 1, 2004
Sold by
Holmes Elwyn A and Holmes Brenda
Bought by
Heon Christopher J
Purchase Details
Closed on
Jun 20, 1997
Sold by
Young Theresa H
Bought by
Holmes Elwyn A
Purchase Details
Closed on
Mar 17, 1989
Sold by
Fortier Suzanne
Bought by
Young Theresa
Create a Home Valuation Report for This Property
The Home Valuation Report is an in-depth analysis detailing your home's value as well as a comparison with similar homes in the area
Home Values in the Area
Average Home Value in this Area
Purchase History
| Date | Buyer | Sale Price | Title Company |
|---|---|---|---|
| Rocchio Felicia M | $126,000 | -- | |
| Mark Anthony Homes Llc | $50,000 | -- | |
| Heon Christopher J | $195,000 | -- | |
| Holmes Elwyn A | $40,000 | -- | |
| Young Theresa | $65,000 | -- |
Source: Public Records
Mortgage History
| Date | Status | Borrower | Loan Amount |
|---|---|---|---|
| Open | Rocchio Felicia M | $100,800 | |
| Previous Owner | Young Theresa | $37,000 | |
| Previous Owner | Young Theresa | $116,500 |
Source: Public Records
Tax History Compared to Growth
Tax History
| Year | Tax Paid | Tax Assessment Tax Assessment Total Assessment is a certain percentage of the fair market value that is determined by local assessors to be the total taxable value of land and additions on the property. | Land | Improvement |
|---|---|---|---|---|
| 2025 | $2,462 | $172,300 | $70,600 | $101,700 |
| 2024 | $2,219 | $118,700 | $44,900 | $73,800 |
| 2023 | $2,175 | $118,700 | $44,900 | $73,800 |
| 2022 | $2,141 | $118,700 | $44,900 | $73,800 |
| 2021 | $1,983 | $86,200 | $36,800 | $49,400 |
| 2020 | $1,983 | $86,200 | $36,800 | $49,400 |
| 2019 | $2,527 | $86,200 | $36,800 | $49,400 |
| 2018 | $1,851 | $70,100 | $34,600 | $35,500 |
| 2017 | $1,844 | $70,100 | $34,600 | $35,500 |
| 2016 | $1,811 | $70,100 | $34,600 | $35,500 |
| 2015 | $1,757 | $67,700 | $34,600 | $33,100 |
| 2014 | $1,719 | $67,700 | $34,600 | $33,100 |
Source: Public Records
Map
Nearby Homes