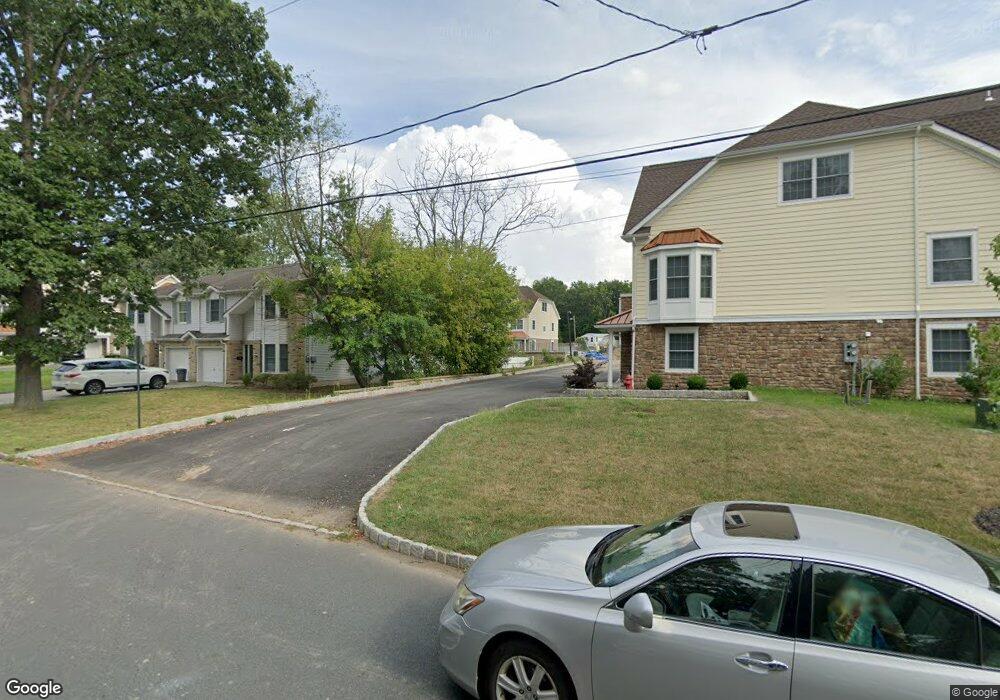
11 Riverbend Ct New Providence, NJ 07974
Estimated Value: $846,000 - $1,031,000
--
Bed
--
Bath
2,352
Sq Ft
$402/Sq Ft
Est. Value
About This Home
This home is located at 11 Riverbend Ct, New Providence, NJ 07974 and is currently estimated at $946,105, approximately $402 per square foot. 11 Riverbend Ct is a home with nearby schools including New Providence High School, The Academy of Our Lady of Peace, and Oak Knoll School of the Holy Child.
Ownership History
Date
Name
Owned For
Owner Type
Purchase Details
Closed on
Aug 15, 2017
Sold by
Maj Realty Inc
Bought by
Kim Nanhye
Current Estimated Value
Home Financials for this Owner
Home Financials are based on the most recent Mortgage that was taken out on this home.
Original Mortgage
$350,750
Outstanding Balance
$187,588
Interest Rate
3.96%
Mortgage Type
New Conventional
Estimated Equity
$758,517
Purchase Details
Closed on
Mar 16, 2017
Sold by
Maj Realty Inc
Bought by
Richter Stewart A and Richter Stewart Thomas
Home Financials for this Owner
Home Financials are based on the most recent Mortgage that was taken out on this home.
Original Mortgage
$454,000
Interest Rate
4.12%
Mortgage Type
New Conventional
Purchase Details
Closed on
Feb 10, 2017
Sold by
Maj Realty Inc
Bought by
Una Efiong Eme
Home Financials for this Owner
Home Financials are based on the most recent Mortgage that was taken out on this home.
Original Mortgage
$454,000
Interest Rate
4.12%
Mortgage Type
New Conventional
Create a Home Valuation Report for This Property
The Home Valuation Report is an in-depth analysis detailing your home's value as well as a comparison with similar homes in the area
Home Values in the Area
Average Home Value in this Area
Purchase History
| Date | Buyer | Sale Price | Title Company |
|---|---|---|---|
| Kim Nanhye | $605,000 | First American Title | |
| Richter Stewart A | $617,000 | None Available | |
| Una Efiong Eme | $647,500 | None Available |
Source: Public Records
Mortgage History
| Date | Status | Borrower | Loan Amount |
|---|---|---|---|
| Open | Kim Nanhye | $350,750 | |
| Previous Owner | Una Efiong Eme | $454,000 |
Source: Public Records
Tax History Compared to Growth
Tax History
| Year | Tax Paid | Tax Assessment Tax Assessment Total Assessment is a certain percentage of the fair market value that is determined by local assessors to be the total taxable value of land and additions on the property. | Land | Improvement |
|---|---|---|---|---|
| 2025 | $15,068 | $291,900 | $50,000 | $241,900 |
| 2024 | $14,615 | $291,900 | $50,000 | $241,900 |
| 2023 | $14,615 | $291,900 | $50,000 | $241,900 |
| 2022 | $14,414 | $291,900 | $50,000 | $241,900 |
| 2021 | $14,309 | $291,900 | $50,000 | $241,900 |
| 2020 | $14,303 | $291,900 | $50,000 | $241,900 |
| 2019 | $14,216 | $291,900 | $50,000 | $241,900 |
| 2018 | $14,143 | $291,900 | $50,000 | $241,900 |
| 2017 | $2,383 | $50,000 | $50,000 | $0 |
Source: Public Records
Map
Nearby Homes
- 16 Riverbend Ct
- 282 South St
- 20 High St
- 34 Grant Ave
- 340 Livingston Ave
- 52 Greenwood Rd
- 1200 Springfield Ave Unit 1B
- 45 the Fellsway
- 54 Badgley Dr
- 14 Holmes Oval
- 16 Terrace Rd
- 32 Charnwood Rd
- 36 Terrace Rd
- 106 Stoneridge Rd
- 29 Walton Ave
- 197 Elkwood Ave
- 72 Central Ave
- 100 Commonwealth Ave
- 140 Countryside Dr
- 19 Slope Dr
- 10 Riverbend Ct Unit 10
- 1 Riverbend Ct
- 1 Riverbend Ct Unit 1
- 9 Riverbend Ct Unit 9
- 12 Riverbend Ct
- 12 Riverbend Ct Unit 12
- 8 Riverbend Ct
- 8 Riverbend Ct Unit 8
- 13 Riverbend Ct Unit 13
- 7 Riverbend Ct
- 14 Riverbend Ct
- 14 Riverbend Ct Unit 14
- 6 Riverbend Ct
- 5 Riverbend Ct Unit 5
- 15 Riverbend Ct
- 15 Riverbend Ct Unit 15
- 232 South St
- 232 South St Unit 1
- 232 South St Unit 2
- 232 South St Unit 5