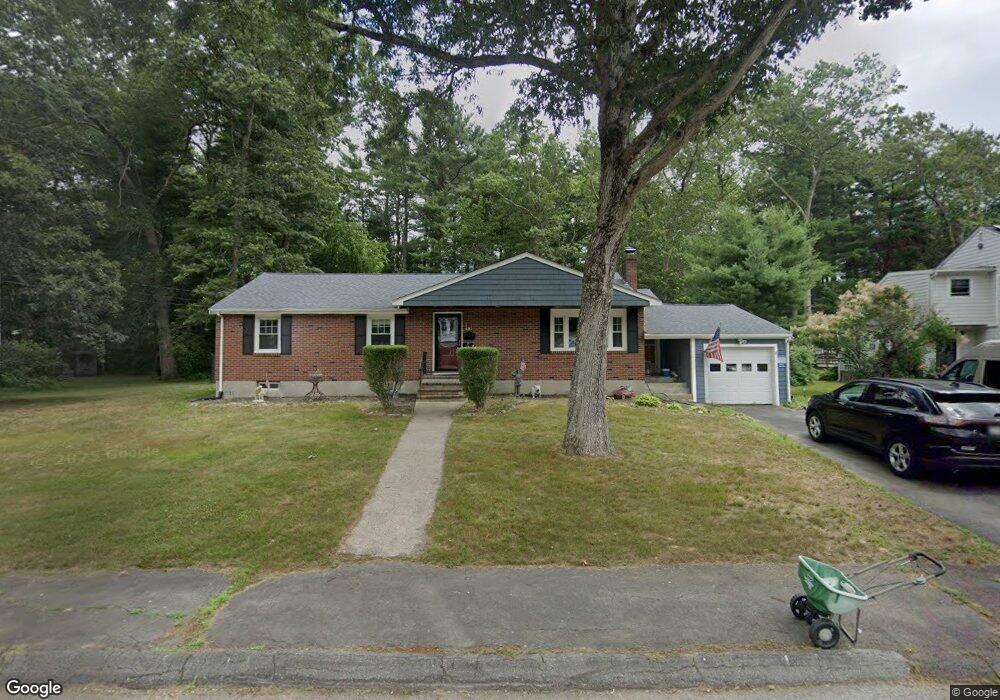
11 Roberta Rd Sharon, MA 02067
Estimated Value: $641,000 - $708,281
3
Beds
1
Bath
1,300
Sq Ft
$522/Sq Ft
Est. Value
About This Home
This home is located at 11 Roberta Rd, Sharon, MA 02067 and is currently estimated at $678,070, approximately $521 per square foot. 11 Roberta Rd is a home located in Norfolk County with nearby schools including Heights Elementary School, Sharon Middle School, and Sharon High School.
Ownership History
Date
Name
Owned For
Owner Type
Purchase Details
Closed on
Feb 13, 2024
Sold by
Mcgrath John J and Mcgrath Kathleen M
Bought by
Mcgrath Ft and Mcgrath
Current Estimated Value
Purchase Details
Closed on
Jun 30, 1995
Sold by
Berbari Jihao and Berbari Maha
Bought by
Mcgrath John J and Mcgrath Kathleen M
Purchase Details
Closed on
Feb 1, 1991
Sold by
Blumenthal Royal A and Blumenthal Sylvia B
Bought by
Berari Jihad
Create a Home Valuation Report for This Property
The Home Valuation Report is an in-depth analysis detailing your home's value as well as a comparison with similar homes in the area
Home Values in the Area
Average Home Value in this Area
Purchase History
| Date | Buyer | Sale Price | Title Company |
|---|---|---|---|
| Mcgrath Ft | -- | None Available | |
| Mcgrath John J | $162,000 | -- | |
| Berari Jihad | $156,000 | -- |
Source: Public Records
Mortgage History
| Date | Status | Borrower | Loan Amount |
|---|---|---|---|
| Previous Owner | Berari Jihad | $153,000 | |
| Previous Owner | Berari Jihad | $50,000 | |
| Previous Owner | Berari Jihad | $165,000 |
Source: Public Records
Tax History Compared to Growth
Tax History
| Year | Tax Paid | Tax Assessment Tax Assessment Total Assessment is a certain percentage of the fair market value that is determined by local assessors to be the total taxable value of land and additions on the property. | Land | Improvement |
|---|---|---|---|---|
| 2025 | $10,207 | $583,900 | $387,100 | $196,800 |
| 2024 | $9,796 | $557,200 | $355,100 | $202,100 |
| 2023 | $9,570 | $514,800 | $331,900 | $182,900 |
| 2022 | $9,213 | $466,500 | $276,600 | $189,900 |
| 2021 | $9,106 | $445,700 | $261,000 | $184,700 |
| 2020 | $8,468 | $445,700 | $261,000 | $184,700 |
| 2019 | $7,865 | $405,200 | $231,000 | $174,200 |
| 2018 | $7,760 | $400,600 | $226,400 | $174,200 |
| 2017 | $7,569 | $385,800 | $211,600 | $174,200 |
| 2016 | $7,445 | $370,200 | $211,600 | $158,600 |
| 2015 | $6,888 | $339,300 | $194,000 | $145,300 |
| 2014 | $6,375 | $310,200 | $176,500 | $133,700 |
Source: Public Records
Map
Nearby Homes
- 27 Sandy Ridge Cir
- 180 Old Post Rd Unit 202
- 180 Old Post Rd Unit 206
- 180 Old Post Rd Unit 308
- 180 Old Post Rd Unit 201
- 180 Old Post Rd Unit 405
- 180 Old Post Rd Unit 207
- 668 S Main St
- Lot One Old Wolomolopoag St
- Lot Two Old Wolomolopoag St
- 5 Trowel Pond Shop Rd Unit C
- 0 U S Route 1
- 277 Everett St
- 54 Depot St
- 29 Station St
- 635 Old Post Rd Unit 303
- 635 Old Post Rd Unit 302
- 32 Billings St Unit A
- 15 Paul Revere Rd
- 2 Thompson Rd