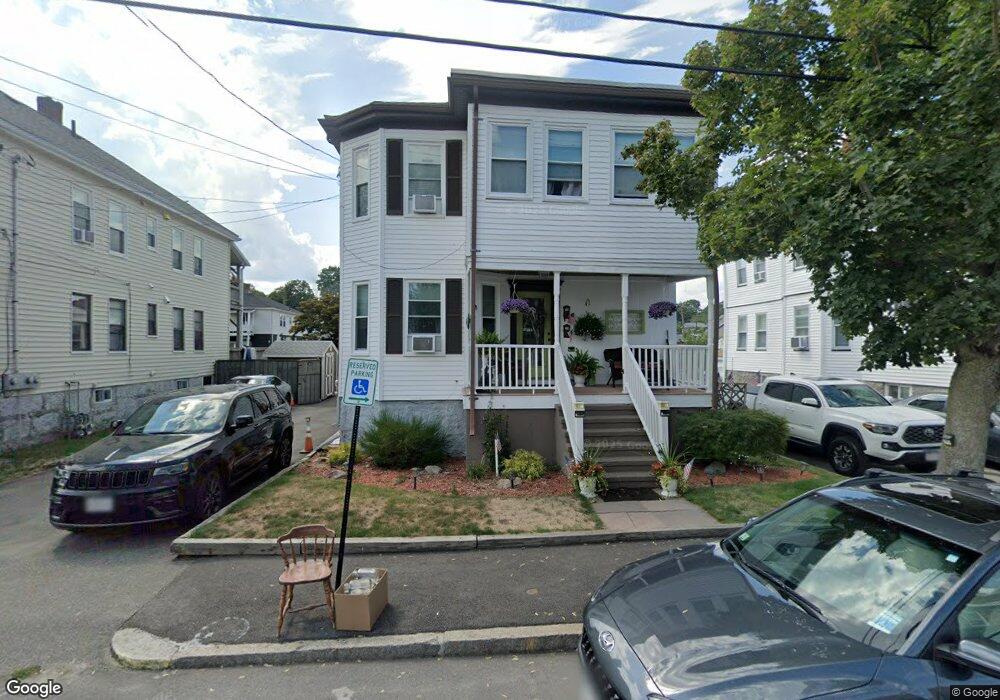
11 Roberts St Quincy, MA 02169
South Quincy NeighborhoodEstimated Value: $877,000 - $1,830,000
5
Beds
2
Baths
2,404
Sq Ft
$485/Sq Ft
Est. Value
About This Home
This home is located at 11 Roberts St, Quincy, MA 02169 and is currently estimated at $1,164,835, approximately $484 per square foot. 11 Roberts St is a home located in Norfolk County with nearby schools including Lincoln-Hancock Community School, South West Middle School, and Quincy High School.
Ownership History
Date
Name
Owned For
Owner Type
Purchase Details
Closed on
Dec 7, 2015
Sold by
Prince Edward Island T
Bought by
Appavoo Ann and Appavoo Jonathan
Current Estimated Value
Home Financials for this Owner
Home Financials are based on the most recent Mortgage that was taken out on this home.
Original Mortgage
$510,000
Outstanding Balance
$408,109
Interest Rate
3.83%
Mortgage Type
New Conventional
Estimated Equity
$756,726
Purchase Details
Closed on
Aug 29, 2000
Sold by
Mckeaggan Paul A
Bought by
Depaulo Donald W and Depaulo Linda D
Home Financials for this Owner
Home Financials are based on the most recent Mortgage that was taken out on this home.
Original Mortgage
$64,000
Interest Rate
8.06%
Mortgage Type
Purchase Money Mortgage
Create a Home Valuation Report for This Property
The Home Valuation Report is an in-depth analysis detailing your home's value as well as a comparison with similar homes in the area
Home Values in the Area
Average Home Value in this Area
Purchase History
| Date | Buyer | Sale Price | Title Company |
|---|---|---|---|
| Appavoo Ann | $900,000 | -- | |
| Depaulo Donald W | $89,000 | -- |
Source: Public Records
Mortgage History
| Date | Status | Borrower | Loan Amount |
|---|---|---|---|
| Open | Appavoo Ann | $510,000 | |
| Previous Owner | Depaulo Donald W | $23,715 | |
| Previous Owner | Depaulo Donald W | $6,000 | |
| Previous Owner | Depaulo Donald W | $64,000 |
Source: Public Records
Tax History
| Year | Tax Paid | Tax Assessment Tax Assessment Total Assessment is a certain percentage of the fair market value that is determined by local assessors to be the total taxable value of land and additions on the property. | Land | Improvement |
|---|---|---|---|---|
| 2025 | $9,382 | $813,700 | $269,900 | $543,800 |
| 2024 | $8,839 | $784,300 | $257,000 | $527,300 |
| 2023 | $8,287 | $744,600 | $233,700 | $510,900 |
| 2022 | $8,125 | $678,200 | $194,700 | $483,500 |
| 2021 | $8,277 | $681,800 | $194,700 | $487,100 |
| 2020 | $8,080 | $650,000 | $194,700 | $455,300 |
| 2019 | $7,687 | $612,500 | $183,700 | $428,800 |
| 2018 | $6,754 | $506,300 | $170,100 | $336,200 |
| 2017 | $6,800 | $479,900 | $162,000 | $317,900 |
| 2016 | $5,984 | $416,700 | $140,900 | $275,800 |
| 2015 | $5,872 | $402,200 | $140,900 | $261,300 |
| 2014 | $5,158 | $347,100 | $140,900 | $206,200 |
Source: Public Records
Map
Nearby Homes
- 64 Garfield St Unit B
- 91 Garfield St
- 21 Arthur St
- 14 Arthur Ave
- 12 Nelson St
- 57 Buckley St
- 46 Suomi Rd Unit 46
- 46 Suomi Rd
- 28 Brook Rd
- 25 McDonald St
- 171-175 Granite St
- 8 Jackson St Unit B4
- 51 Branch St Unit 2
- 36 Village Dr
- 21 Totman St Unit 308
- 21 Totman St Unit 205
- 21 Totman St Unit 404
- 21 Totman St Unit 309
- 21 Totman St Unit 307
- 21 Totman St Unit 203
- 15 Roberts St
- 7 Roberts St
- 9 Roberts St Unit 9
- 21 Roberts St
- 19 Roberts St
- 14 Grossman St
- 18 Grossman St
- 18 Roberts St
- 10 Roberts St
- 22 Grossman St
- 10 Grossman St
- 12 Roberts St Unit 12
- 25 Roberts St
- 14 Roberts St
- 14 Roberts St Unit 2
- 14 Roberts St Unit 1
- 24 Grossman St Unit 2
- 22 Roberts St
- 364 Water St
- 26 Grossman St
Your Personal Tour Guide
Ask me questions while you tour the home.