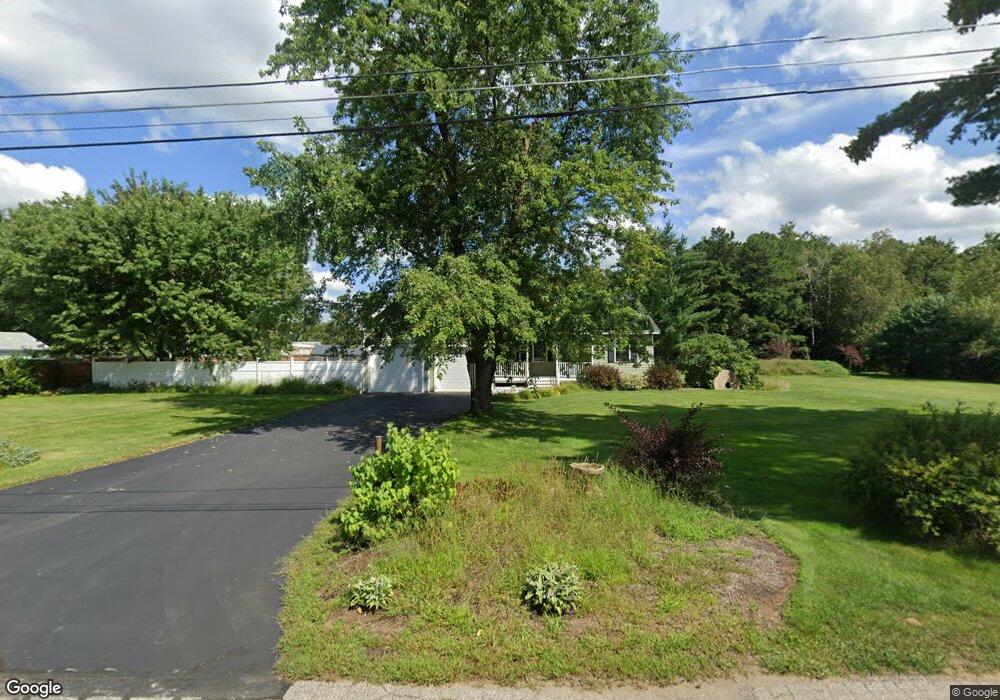
11 Robinson St Concord, NH 03301
Concord Heights NeighborhoodEstimated Value: $468,000 - $568,000
3
Beds
2
Baths
1,584
Sq Ft
$325/Sq Ft
Est. Value
About This Home
This home is located at 11 Robinson St, Concord, NH 03301 and is currently estimated at $514,259, approximately $324 per square foot. 11 Robinson St is a home located in Merrimack County with nearby schools including Broken Ground School, Rundlett Middle School, and Concord High School.
Ownership History
Date
Name
Owned For
Owner Type
Purchase Details
Closed on
Jan 26, 2024
Sold by
St Onge Richard M and St Onge Joyce L
Bought by
St Onge Ft and St Onge
Current Estimated Value
Purchase Details
Closed on
Jun 30, 2010
Sold by
Langevin Ronald D and Langevin Claire G
Bought by
Stonge Richard M and Stonge Joyce L
Home Financials for this Owner
Home Financials are based on the most recent Mortgage that was taken out on this home.
Original Mortgage
$196,000
Interest Rate
4.88%
Mortgage Type
Purchase Money Mortgage
Create a Home Valuation Report for This Property
The Home Valuation Report is an in-depth analysis detailing your home's value as well as a comparison with similar homes in the area
Home Values in the Area
Average Home Value in this Area
Purchase History
| Date | Buyer | Sale Price | Title Company |
|---|---|---|---|
| St Onge Ft | -- | None Available | |
| Stonge Richard M | $70,000 | -- |
Source: Public Records
Mortgage History
| Date | Status | Borrower | Loan Amount |
|---|---|---|---|
| Previous Owner | Stonge Richard M | $231,085 | |
| Previous Owner | Stonge Richard M | $196,000 |
Source: Public Records
Tax History Compared to Growth
Tax History
| Year | Tax Paid | Tax Assessment Tax Assessment Total Assessment is a certain percentage of the fair market value that is determined by local assessors to be the total taxable value of land and additions on the property. | Land | Improvement |
|---|---|---|---|---|
| 2024 | $10,104 | $364,900 | $114,300 | $250,600 |
| 2023 | $9,734 | $362,400 | $114,300 | $248,100 |
| 2022 | $9,383 | $362,400 | $114,300 | $248,100 |
| 2021 | $9,103 | $362,400 | $114,300 | $248,100 |
| 2020 | $8,668 | $323,900 | $83,900 | $240,000 |
| 2019 | $8,706 | $313,400 | $80,000 | $233,400 |
| 2018 | $7,486 | $285,500 | $80,000 | $205,500 |
| 2017 | $7,416 | $262,600 | $76,300 | $186,300 |
| 2016 | $7,136 | $257,900 | $76,300 | $181,600 |
| 2015 | $6,463 | $236,400 | $76,300 | $160,100 |
| 2014 | $6,338 | $236,400 | $76,300 | $160,100 |
| 2013 | $5,937 | $232,100 | $76,300 | $155,800 |
| 2012 | $5,549 | $227,700 | $76,300 | $151,400 |
Source: Public Records
Map
Nearby Homes
- 17 Burns Ave Unit 2
- 13 Ellsworth St
- 12 E Side Dr Unit 4-13
- 6 Heights Rd
- 32 E Side Dr
- 6 Lawrence Street Extension
- 43 Branch Turnpike
- 50 Branch Turnpike
- 58 Branch Turnpike Unit 26
- 59 Branch Turnpike
- 1 Guay St
- 24 Cricket Ln
- 8 NE Village Rd
- 19 Grappone Dr
- 33 Mulberry St Unit 2
- 15 Bridle Path Trail
- 9 Strawberry Ln
- 7 Highridge Trail
- 294 Portsmouth St
- 69 Manchester St Unit Lot 18