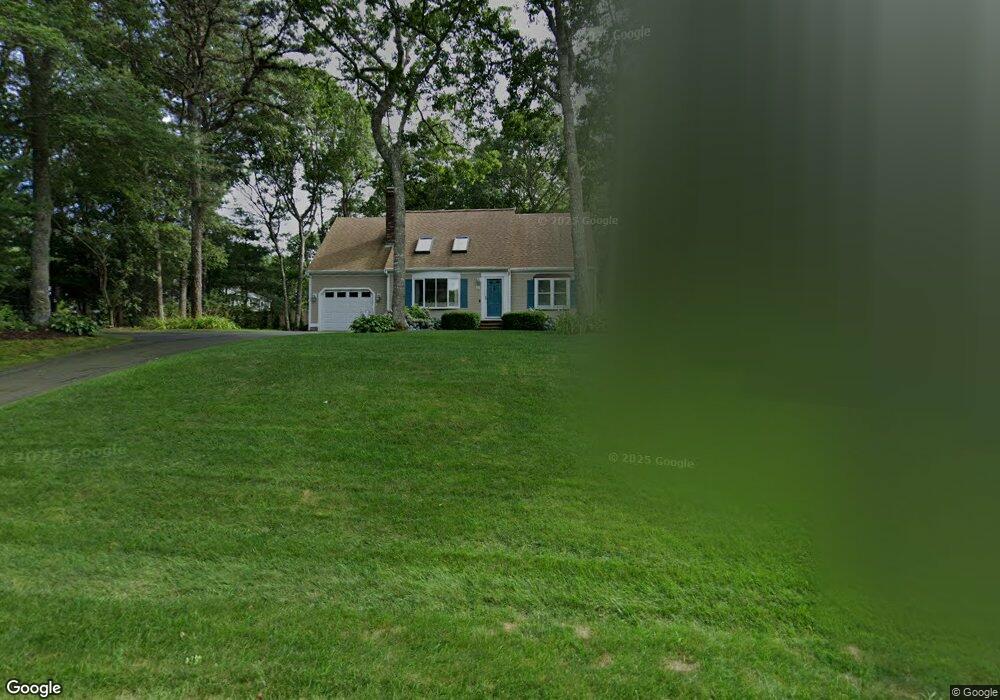
11 Rolling Oaks Dr Pocasset, MA 02559
Pocasset NeighborhoodEstimated Value: $591,000 - $648,306
3
Beds
3
Baths
1,516
Sq Ft
$417/Sq Ft
Est. Value
About This Home
This home is located at 11 Rolling Oaks Dr, Pocasset, MA 02559 and is currently estimated at $632,077, approximately $416 per square foot. 11 Rolling Oaks Dr is a home located in Barnstable County with nearby schools including Bourne High School, Cadence Academy Preschool - Bourne, and St Margaret Regional School.
Ownership History
Date
Name
Owned For
Owner Type
Purchase Details
Closed on
Oct 2, 2023
Sold by
Iannella Christopher G
Bought by
Anchor Point Property Llc
Current Estimated Value
Purchase Details
Closed on
Dec 30, 2010
Sold by
Fnma
Bought by
Iannella Christopher G
Home Financials for this Owner
Home Financials are based on the most recent Mortgage that was taken out on this home.
Original Mortgage
$244,000
Interest Rate
4.37%
Mortgage Type
Purchase Money Mortgage
Purchase Details
Closed on
Aug 27, 2010
Sold by
Decicco Rhonda L and Fnma
Bought by
Federal National Mortgage Association
Purchase Details
Closed on
May 1, 1992
Sold by
First Eastern Mtg Corp
Bought by
Tantillo Decicco L and Tantillo Rhonda L
Create a Home Valuation Report for This Property
The Home Valuation Report is an in-depth analysis detailing your home's value as well as a comparison with similar homes in the area
Home Values in the Area
Average Home Value in this Area
Purchase History
| Date | Buyer | Sale Price | Title Company |
|---|---|---|---|
| Anchor Point Property Llc | -- | None Available | |
| Iannella Christopher G | $305,000 | -- | |
| Iannella Christopher G | $305,000 | -- | |
| Federal National Mortgage Association | $298,909 | -- | |
| Federal National Mortgage Association | $298,909 | -- | |
| Tantillo Decicco L | $125,000 | -- | |
| Tantillo Decicco L | $125,000 | -- |
Source: Public Records
Mortgage History
| Date | Status | Borrower | Loan Amount |
|---|---|---|---|
| Previous Owner | Tantillo Decicco L | $242,000 | |
| Previous Owner | Tantillo Decicco L | $244,000 | |
| Previous Owner | Iannella Christopher G | $244,000 |
Source: Public Records
Tax History Compared to Growth
Tax History
| Year | Tax Paid | Tax Assessment Tax Assessment Total Assessment is a certain percentage of the fair market value that is determined by local assessors to be the total taxable value of land and additions on the property. | Land | Improvement |
|---|---|---|---|---|
| 2025 | $4,276 | $547,500 | $204,600 | $342,900 |
| 2024 | $4,182 | $521,400 | $194,900 | $326,500 |
| 2023 | $4,100 | $465,400 | $172,500 | $292,900 |
| 2022 | $3,893 | $385,800 | $152,600 | $233,200 |
| 2021 | $3,787 | $351,600 | $138,900 | $212,700 |
| 2020 | $3,567 | $332,100 | $137,600 | $194,500 |
| 2019 | $3,378 | $321,400 | $137,600 | $183,800 |
| 2018 | $3,252 | $308,500 | $131,100 | $177,400 |
| 2017 | $3,361 | $326,300 | $142,200 | $184,100 |
| 2016 | $3,148 | $309,800 | $142,200 | $167,600 |
| 2015 | $2,855 | $283,500 | $123,600 | $159,900 |
Source: Public Records
Map
Nearby Homes
- 940 County Rd
- 7 4th Ave
- 15 1st St
- 940 County Rd
- 174 Barlows Landing Rd
- 7 Portside Dr
- 709 County Rd
- 1094 County Rd
- 254 Barlows Landing Rd
- 3 Red Brook Pond Dr
- 48 Red Brook Harbor Rd
- 22 Nairn Rd
- 1234 Route 28a
- 1234 Route 28a
- 39 Bennets Neck Dr
- 171 Bellavista Dr
- 14 Navajo Rd
- 34 Kenwood Rd
- 45 Kenwood Rd
- 70 Wings Neck Rd
- 15 Rolling Oaks Dr
- 9 Rolling Oaks Dr
- 4 Acorn Cir
- 4 Acorn Cir
- 12 Rolling Oaks Dr
- 10 Rolling Oaks Dr
- 10 Rolling Oaks Dr Unit 10
- 10 Rolling Oaks Dr
- 20 Rolling Oaks Dr Unit OAKS
- 20 Rolling Oaks Dr
- 895 County Rd
- 14 Rolling Oaks Dr
- 8 Rolling Oaks Dr
- 891 County Rd
- 897 County Rd
- 16 Rolling Oaks Dr
- 905 County Rd
- 5 Rolling Oaks Dr
- 5 Acorn Cir
- 6 Rolling Oaks Dr