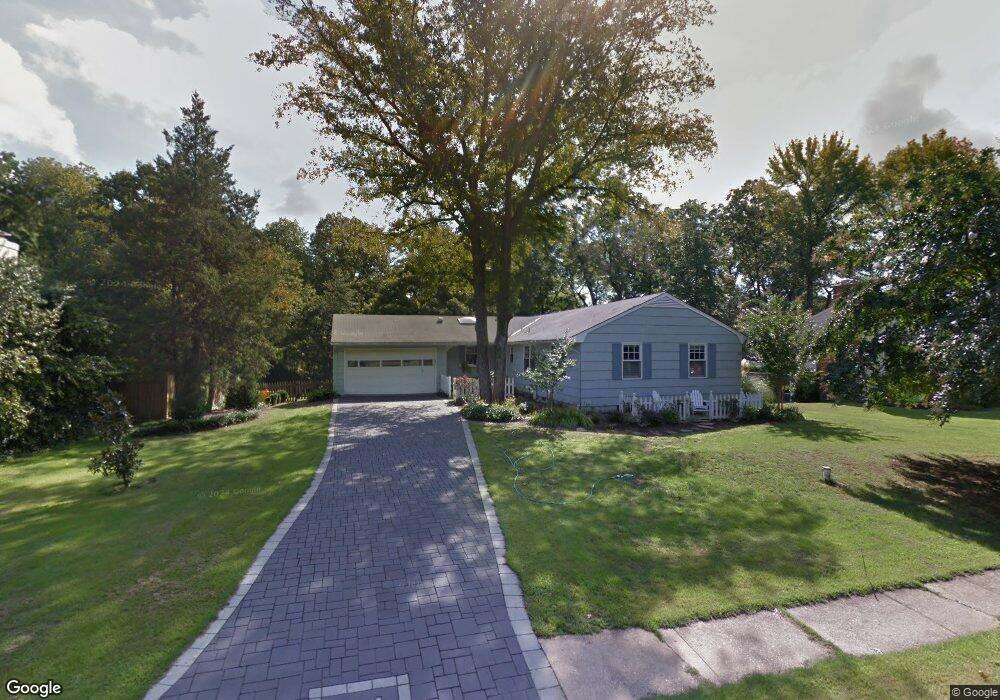
11 Romar Dr Annapolis, MD 21403
Estimated Value: $731,469 - $857,000
4
Beds
2
Baths
1,668
Sq Ft
$478/Sq Ft
Est. Value
About This Home
This home is located at 11 Romar Dr, Annapolis, MD 21403 and is currently estimated at $796,617, approximately $477 per square foot. 11 Romar Dr is a home located in Anne Arundel County with nearby schools including Hillsmere Elementary School, Annapolis Middle School, and Annapolis High School.
Ownership History
Date
Name
Owned For
Owner Type
Purchase Details
Closed on
Jun 3, 2008
Sold by
Tierney David W
Bought by
O'Day Jodi R and Bingham Rick L
Current Estimated Value
Home Financials for this Owner
Home Financials are based on the most recent Mortgage that was taken out on this home.
Original Mortgage
$200,000
Outstanding Balance
$128,732
Interest Rate
6.11%
Mortgage Type
Stand Alone Second
Estimated Equity
$667,885
Purchase Details
Closed on
May 23, 2008
Sold by
Tierney David W
Bought by
O'Day Jodi R and Bingham Rick L
Home Financials for this Owner
Home Financials are based on the most recent Mortgage that was taken out on this home.
Original Mortgage
$200,000
Outstanding Balance
$128,732
Interest Rate
6.11%
Mortgage Type
Stand Alone Second
Estimated Equity
$667,885
Purchase Details
Closed on
Dec 11, 2002
Sold by
Welch Peter B
Bought by
Tierney David W and Tierney Pamela A
Purchase Details
Closed on
Oct 2, 1997
Sold by
Strange Ann B
Bought by
Welch Peter B and Welch Tracy D
Create a Home Valuation Report for This Property
The Home Valuation Report is an in-depth analysis detailing your home's value as well as a comparison with similar homes in the area
Home Values in the Area
Average Home Value in this Area
Purchase History
| Date | Buyer | Sale Price | Title Company |
|---|---|---|---|
| O'Day Jodi R | $605,000 | -- | |
| O'Day Jodi R | $605,000 | -- | |
| Tierney David W | $400,000 | -- | |
| Welch Peter B | $210,000 | -- |
Source: Public Records
Mortgage History
| Date | Status | Borrower | Loan Amount |
|---|---|---|---|
| Open | O'Day Jodi R | $200,000 | |
| Closed | O'Day Jodi R | $200,000 | |
| Closed | Welch Peter B | -- |
Source: Public Records
Tax History Compared to Growth
Tax History
| Year | Tax Paid | Tax Assessment Tax Assessment Total Assessment is a certain percentage of the fair market value that is determined by local assessors to be the total taxable value of land and additions on the property. | Land | Improvement |
|---|---|---|---|---|
| 2025 | $6,272 | $583,000 | -- | -- |
| 2024 | $6,272 | $555,100 | $0 | $0 |
| 2023 | $5,622 | $527,200 | $317,400 | $209,800 |
| 2022 | $5,706 | $517,467 | $0 | $0 |
| 2021 | $0 | $507,733 | $0 | $0 |
| 2020 | $5,986 | $498,000 | $317,400 | $180,600 |
| 2019 | $5,878 | $483,967 | $0 | $0 |
| 2018 | $5,613 | $469,933 | $0 | $0 |
| 2017 | $5,538 | $455,900 | $0 | $0 |
| 2016 | $414 | $455,900 | $0 | $0 |
| 2015 | $414 | $455,900 | $0 | $0 |
| 2014 | -- | $457,500 | $0 | $0 |
Source: Public Records
Map
Nearby Homes
- 8 Ashford Ct
- 7 Ashford Ct
- 311 Canterfield Rd
- 30 Ironstone Ct
- 10 Ironstone Ct
- 310 Saddle Ridge Rd
- 3182 Harness Creek Rd
- 20 Sandstone Ct
- 401 Fair Hill Ct
- 8 Somerset Ct
- 20 Amberstone Ct Unit 20A
- 122 Roselawn Rd
- 410 Fox Hollow Ln
- 8 Rockwell Ct
- 1411 Stonecreek Rd
- 795 Harness Creek View Dr
- 3245 Harness Creek Rd
- 917 Arbutus Rd
- 113 Treblis Way
- 52 Primrose Hill Ln