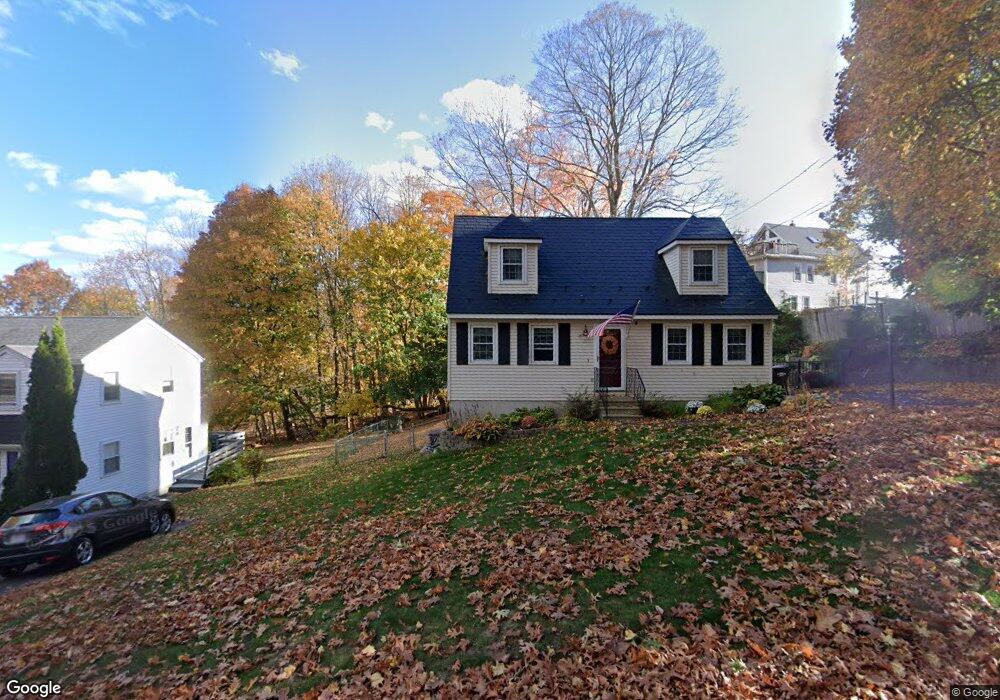
11 Rowell St Amesbury, MA 01913
Estimated Value: $548,000 - $675,000
3
Beds
2
Baths
1,428
Sq Ft
$427/Sq Ft
Est. Value
About This Home
This home is located at 11 Rowell St, Amesbury, MA 01913 and is currently estimated at $610,345, approximately $427 per square foot. 11 Rowell St is a home located in Essex County with nearby schools including Amesbury High School and Amesbury Seventh-Day Adventist School.
Ownership History
Date
Name
Owned For
Owner Type
Purchase Details
Closed on
Jul 28, 2020
Sold by
Warren Katherine K and Warren Wayne E
Bought by
Warren Wayne E
Current Estimated Value
Home Financials for this Owner
Home Financials are based on the most recent Mortgage that was taken out on this home.
Original Mortgage
$307,400
Outstanding Balance
$271,455
Interest Rate
3%
Mortgage Type
New Conventional
Estimated Equity
$338,890
Purchase Details
Closed on
Sep 26, 1997
Sold by
Phinney Debra J
Bought by
Warren Wayne E and Warren Katherine K
Create a Home Valuation Report for This Property
The Home Valuation Report is an in-depth analysis detailing your home's value as well as a comparison with similar homes in the area
Home Values in the Area
Average Home Value in this Area
Purchase History
| Date | Buyer | Sale Price | Title Company |
|---|---|---|---|
| Warren Wayne E | -- | None Available | |
| Warren Wayne E | $155,500 | -- |
Source: Public Records
Mortgage History
| Date | Status | Borrower | Loan Amount |
|---|---|---|---|
| Open | Warren Wayne E | $307,400 | |
| Previous Owner | Warren Wayne E | $25,400 | |
| Previous Owner | Warren Wayne E | $305,000 |
Source: Public Records
Tax History Compared to Growth
Tax History
| Year | Tax Paid | Tax Assessment Tax Assessment Total Assessment is a certain percentage of the fair market value that is determined by local assessors to be the total taxable value of land and additions on the property. | Land | Improvement |
|---|---|---|---|---|
| 2025 | $7,690 | $502,600 | $182,200 | $320,400 |
| 2024 | $7,892 | $504,600 | $171,900 | $332,700 |
| 2023 | $6,946 | $425,100 | $149,400 | $275,700 |
| 2022 | $6,331 | $357,900 | $129,900 | $228,000 |
| 2021 | $5,897 | $323,100 | $100,400 | $222,700 |
| 2020 | $5,276 | $307,100 | $96,500 | $210,600 |
| 2019 | $5,381 | $292,900 | $96,500 | $196,400 |
| 2018 | $5,357 | $282,100 | $91,900 | $190,200 |
| 2017 | $5,125 | $256,900 | $91,900 | $165,000 |
| 2016 | $5,066 | $249,800 | $91,900 | $157,900 |
| 2015 | $5,030 | $244,900 | $91,900 | $153,000 |
| 2014 | $4,590 | $218,900 | $91,900 | $127,000 |
Source: Public Records
Map
Nearby Homes
- 3 Arlington St
- 102 Market St
- 105 Market St Unit B
- 101 Market St Unit B
- 101 Market St Unit A
- 48 Orchard St
- 25 Cedar St Unit 4
- 25 Cedar St Unit 14
- 25 Cedar St Unit 7
- 4 Winter St
- 13 High St Unit 2
- 97 Elm St
- 37 Millyard Unit 204
- 57 Clinton St
- 118 Elm St
- 1 Brown Ave Unit 1-37
- 1 Brown Ave Unit 3-80
- 93 Friend St
- 22 Huntington Ave
- 25 Whittier Meadows Dr