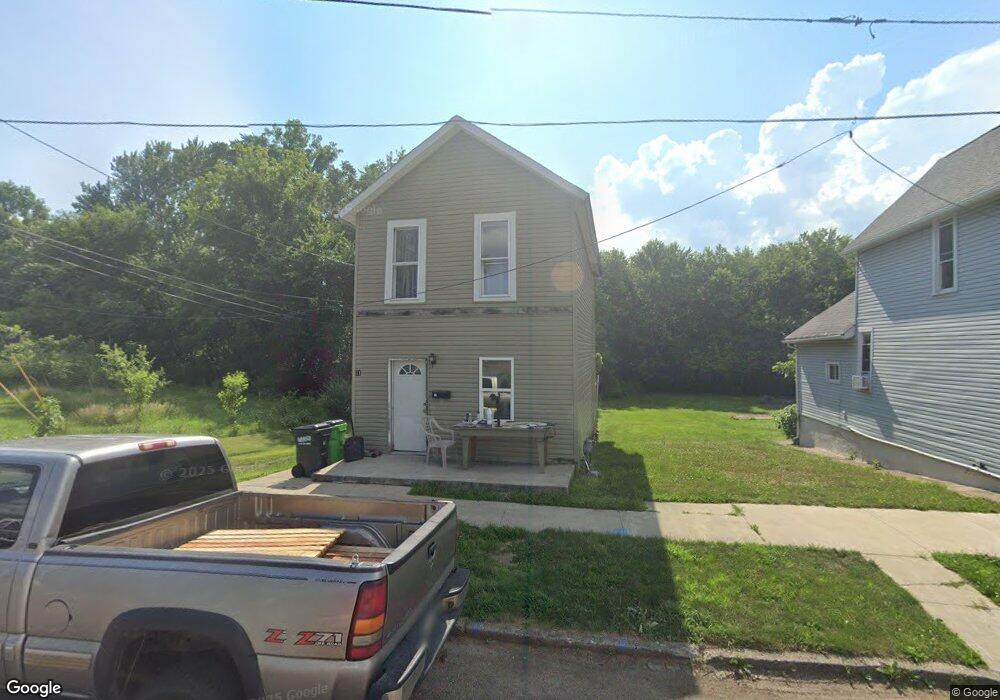
11 S 2nd St Dennison, OH 44621
Estimated Value: $88,000 - $124,000
2
Beds
1
Bath
1,317
Sq Ft
$77/Sq Ft
Est. Value
About This Home
This home is located at 11 S 2nd St, Dennison, OH 44621 and is currently estimated at $102,035, approximately $77 per square foot. 11 S 2nd St is a home located in Tuscarawas County with nearby schools including Claymont High School and Immaculate Conception School.
Ownership History
Date
Name
Owned For
Owner Type
Purchase Details
Closed on
Sep 23, 2011
Sold by
Bentoski Richard Allen and Bentoski Cindy L
Bought by
Bland Raymond S and Bland Carol L
Current Estimated Value
Purchase Details
Closed on
Dec 17, 2007
Sold by
Richardson Florence M and Carter Carol
Bought by
Bentoski Richard Allen and Bentoski Cindy L
Purchase Details
Closed on
Oct 23, 1991
Sold by
Richardson Myrtle A
Bought by
Bland Raymond S
Purchase Details
Closed on
Feb 6, 1989
Sold by
Richardson Thomas and Richardson Myrtle
Bought by
Bland Raymond S
Create a Home Valuation Report for This Property
The Home Valuation Report is an in-depth analysis detailing your home's value as well as a comparison with similar homes in the area
Home Values in the Area
Average Home Value in this Area
Purchase History
| Date | Buyer | Sale Price | Title Company |
|---|---|---|---|
| Bland Raymond S | $3,000 | Tusc Title | |
| Bentoski Richard Allen | $7,500 | Tusc Title | |
| Bland Raymond S | -- | -- | |
| Bland Raymond S | -- | -- |
Source: Public Records
Tax History Compared to Growth
Tax History
| Year | Tax Paid | Tax Assessment Tax Assessment Total Assessment is a certain percentage of the fair market value that is determined by local assessors to be the total taxable value of land and additions on the property. | Land | Improvement |
|---|---|---|---|---|
| 2024 | $664 | $17,830 | $2,140 | $15,690 |
| 2023 | $664 | $50,930 | $6,110 | $44,820 |
| 2022 | $670 | $17,826 | $2,139 | $15,687 |
| 2021 | $597 | $14,823 | $1,383 | $13,440 |
| 2020 | $640 | $14,823 | $1,383 | $13,440 |
| 2019 | $579 | $14,823 | $1,383 | $13,440 |
| 2018 | $533 | $12,510 | $1,170 | $11,340 |
| 2017 | $547 | $12,510 | $1,170 | $11,340 |
| 2016 | $551 | $12,510 | $1,170 | $11,340 |
| 2014 | $547 | $12,460 | $1,170 | $11,290 |
| 2013 | $552 | $12,460 | $1,170 | $11,290 |
Source: Public Records
Map
Nearby Homes