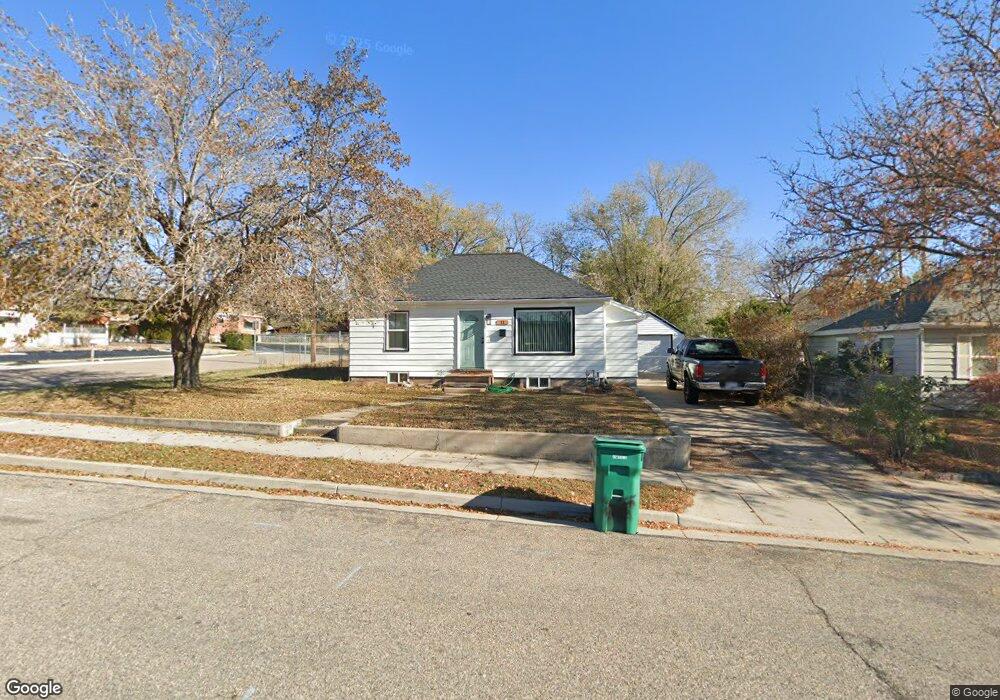
11 S 450 E Clearfield, UT 84015
Estimated Value: $326,000 - $377,128
4
Beds
2
Baths
1,361
Sq Ft
$258/Sq Ft
Est. Value
About This Home
This home is located at 11 S 450 E, Clearfield, UT 84015 and is currently estimated at $350,532, approximately $257 per square foot. 11 S 450 E is a home located in Davis County with nearby schools including Wasatch Elementary School, North Davis Junior High School, and Clearfield High School.
Ownership History
Date
Name
Owned For
Owner Type
Purchase Details
Closed on
Jan 19, 2022
Sold by
Rigby Home Buyers Llc
Bought by
Sughrue Michael T and Sughrue Magaret A
Current Estimated Value
Home Financials for this Owner
Home Financials are based on the most recent Mortgage that was taken out on this home.
Original Mortgage
$337,810
Outstanding Balance
$310,249
Interest Rate
3.45%
Mortgage Type
FHA
Estimated Equity
$40,283
Purchase Details
Closed on
Jul 29, 2021
Sold by
Thompson Al
Bought by
Rigby Home Buyers Llc
Home Financials for this Owner
Home Financials are based on the most recent Mortgage that was taken out on this home.
Original Mortgage
$185,000
Interest Rate
2.93%
Mortgage Type
Commercial
Create a Home Valuation Report for This Property
The Home Valuation Report is an in-depth analysis detailing your home's value as well as a comparison with similar homes in the area
Home Values in the Area
Average Home Value in this Area
Purchase History
| Date | Buyer | Sale Price | Title Company |
|---|---|---|---|
| Sughrue Michael T | -- | None Listed On Document | |
| Rigby Home Buyers Llc | -- | Stewart Title Ins Age | |
| Thompson Al | -- | Monument Title Insurance |
Source: Public Records
Mortgage History
| Date | Status | Borrower | Loan Amount |
|---|---|---|---|
| Open | Sughrue Michael T | $337,810 | |
| Previous Owner | Thompson Al | $185,000 | |
| Previous Owner | Rigby Home Buyers Llc | $205,000 |
Source: Public Records
Tax History
| Year | Tax Paid | Tax Assessment Tax Assessment Total Assessment is a certain percentage of the fair market value that is determined by local assessors to be the total taxable value of land and additions on the property. | Land | Improvement |
|---|---|---|---|---|
| 2025 | $1,964 | $176,000 | $72,833 | $103,167 |
| 2024 | $1,944 | $175,450 | $69,600 | $105,850 |
| 2023 | $1,853 | $307,000 | $110,958 | $196,042 |
| 2022 | $1,976 | $322,000 | $114,983 | $207,017 |
| 2021 | $560 | $200,000 | $69,276 | $130,724 |
| 2020 | $1,309 | $176,000 | $58,665 | $117,335 |
| 2019 | $1,258 | $167,000 | $60,001 | $106,999 |
| 2018 | $1,121 | $145,000 | $50,594 | $94,406 |
| 2016 | $982 | $66,385 | $21,416 | $44,969 |
| 2015 | $909 | $58,575 | $21,416 | $37,159 |
| 2014 | $180 | $52,919 | $21,416 | $31,503 |
| 2013 | -- | $43,846 | $21,885 | $21,961 |
Source: Public Records
Map
Nearby Homes
Your Personal Tour Guide
Ask me questions while you tour the home.