
Seller's Agent in 2021
Craig Power
Power Realty Advisors
(617) 750-1205
1 in this area
38 Total Sales
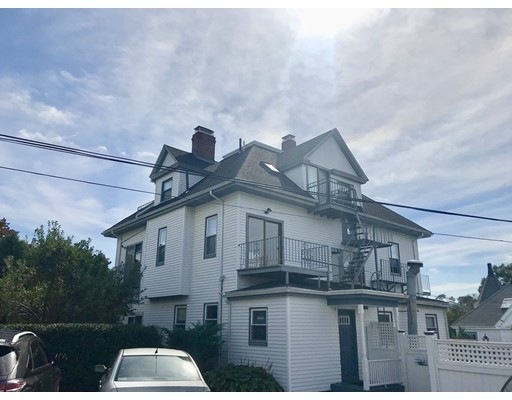
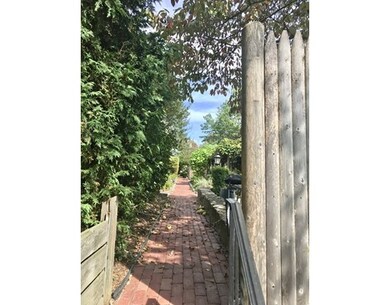
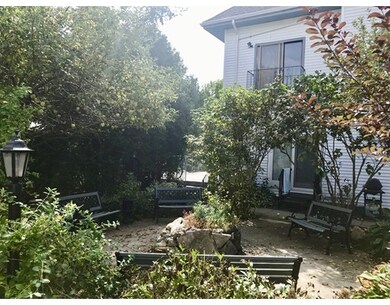
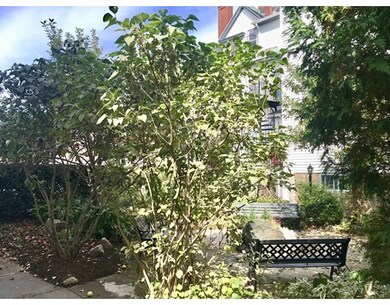
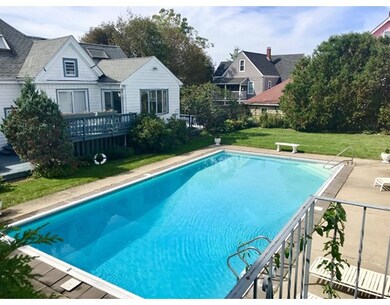
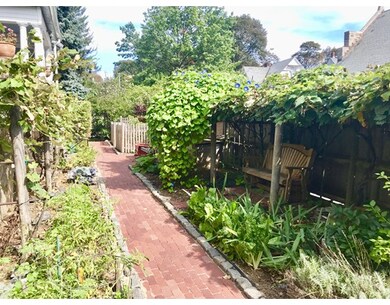
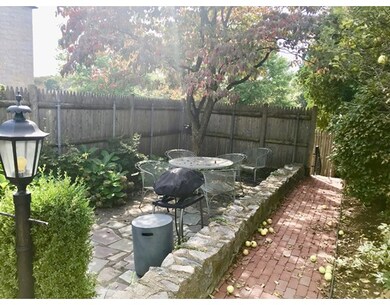
CALLING ALL INVESTORS...COME TAKE A LOOK...GREAT OPPORTUNITY. INTERIOR OF UNIT IS IN NEED OF COMPLETE REHAB. GREAT SMALL PROJECT AND A GREAT INVESTMENT FOR FLIP OR KEEP FOR A RENTAL. LOCATION IS PERFECT AND THE GROUNDS OF THE COMPLEX IS EVEN BETTER. HIDDEN LITTLE GEM, IN GROUND POOL AND LOTS OF RED BRICK WALKWAYS WITH OUTDOOR SEATING. ****MUST BE ALL CASH****
Home Type
Condominium
Est. Annual Taxes
$4,784
Year Built
1940
Lot Details
0
| Date | Type | Sale Price | Title Company |
|---|---|---|---|
| Not Resolvable | $370,000 | None Available | |
| Warranty Deed | $330,000 | -- | |
| Not Resolvable | $151,000 | -- | |
| Warranty Deed | $147 | -- | |
| Warranty Deed | $114,440 | -- |
| Date | Status | Loan Amount | Loan Type |
|---|---|---|---|
| Open | $314,500 | Purchase Money Mortgage | |
| Previous Owner | $264,000 | New Conventional | |
| Previous Owner | $151,000 | New Conventional |
| Date | Event | Price | Change | Sq Ft Price |
|---|---|---|---|---|
| 01/29/2021 01/29/21 | Sold | $370,000 | -1.1% | $761 / Sq Ft |
| 12/08/2020 12/08/20 | Pending | -- | -- | -- |
| 12/02/2020 12/02/20 | For Sale | $374,000 | +13.3% | $770 / Sq Ft |
| 11/09/2018 11/09/18 | Sold | $330,000 | +0.3% | $679 / Sq Ft |
| 10/02/2018 10/02/18 | Pending | -- | -- | -- |
| 09/21/2018 09/21/18 | For Sale | $329,000 | +117.9% | $677 / Sq Ft |
| 05/07/2018 05/07/18 | Sold | $151,000 | +0.7% | $311 / Sq Ft |
| 10/20/2017 10/20/17 | Pending | -- | -- | -- |
| 10/10/2017 10/10/17 | For Sale | $149,900 | -- | $308 / Sq Ft |
| Year | Tax Paid | Tax Assessment Tax Assessment Total Assessment is a certain percentage of the fair market value that is determined by local assessors to be the total taxable value of land and additions on the property. | Land | Improvement |
|---|---|---|---|---|
| 2025 | $4,784 | $413,100 | $0 | $413,100 |
| 2024 | $4,375 | $401,400 | $0 | $401,400 |
| 2023 | $4,226 | $393,500 | $0 | $393,500 |
| 2022 | $4,003 | $367,900 | $0 | $367,900 |
| 2021 | $3,656 | $342,600 | $0 | $342,600 |
| 2020 | $3,013 | $285,300 | $0 | $285,300 |
| 2019 | $3,084 | $292,600 | $0 | $292,600 |
| 2018 | $2,254 | $215,100 | $0 | $215,100 |
| 2017 | $1,844 | $174,100 | $0 | $174,100 |
| 2016 | $1,757 | $159,700 | $0 | $159,700 |
| 2015 | $2,341 | $193,300 | $0 | $193,300 |
| 2014 | $2,253 | $179,100 | $0 | $179,100 |
Seller's Agent in 2021
Craig Power
Power Realty Advisors
(617) 750-1205
1 in this area
38 Total Sales
Buyer's Agent in 2021
Jeff Shmase
Coldwell Banker Realty - Lynnfield
(508) 527-0291
1 in this area
23 Total Sales
Seller's Agent in 2018
Megan Flaherty
William Raveis R. E. & Home Services
(508) 395-6528
1 in this area
22 Total Sales
T
Seller's Agent in 2018
The Buliung Group
Laer Realty
Buyer's Agent in 2018
Richard Sampson
Duhallow Real Estate
(617) 922-1630
2 Total Sales
Source: MLS Property Information Network (MLS PIN)
MLS Number: 72240675
APN: ROSL-000000-000020-005511-000036
Disclaimer: Certain information contained herein is derived from information provided by parties other than Homes.com. All information provided is deemed reliable, but is not guaranteed to be accurate and should be independently verified.
![]() The property listing data and information, or the Images, set forth herein were provided to MLS Property Information Network, Inc. from third party sources, including sellers, lessors and public records, and were compiled by MLS Property Information Network, Inc. The property listing data and information, and the Images, are for the personal, non-commercial use of consumers having a good faith interest in purchasing or leasing listed properties of the type displayed to them and may not be used for any purpose other than to identify prospective properties which such consumers may have a good faith interest in purchasing or leasing. MLS Property Information Network, Inc. and its subscribers disclaim any and all representations and warranties as to the accuracy of the property listing data and information, or as to the accuracy of any of the Images, set forth herein.
The property listing data and information, or the Images, set forth herein were provided to MLS Property Information Network, Inc. from third party sources, including sellers, lessors and public records, and were compiled by MLS Property Information Network, Inc. The property listing data and information, and the Images, are for the personal, non-commercial use of consumers having a good faith interest in purchasing or leasing listed properties of the type displayed to them and may not be used for any purpose other than to identify prospective properties which such consumers may have a good faith interest in purchasing or leasing. MLS Property Information Network, Inc. and its subscribers disclaim any and all representations and warranties as to the accuracy of the property listing data and information, or as to the accuracy of any of the Images, set forth herein.