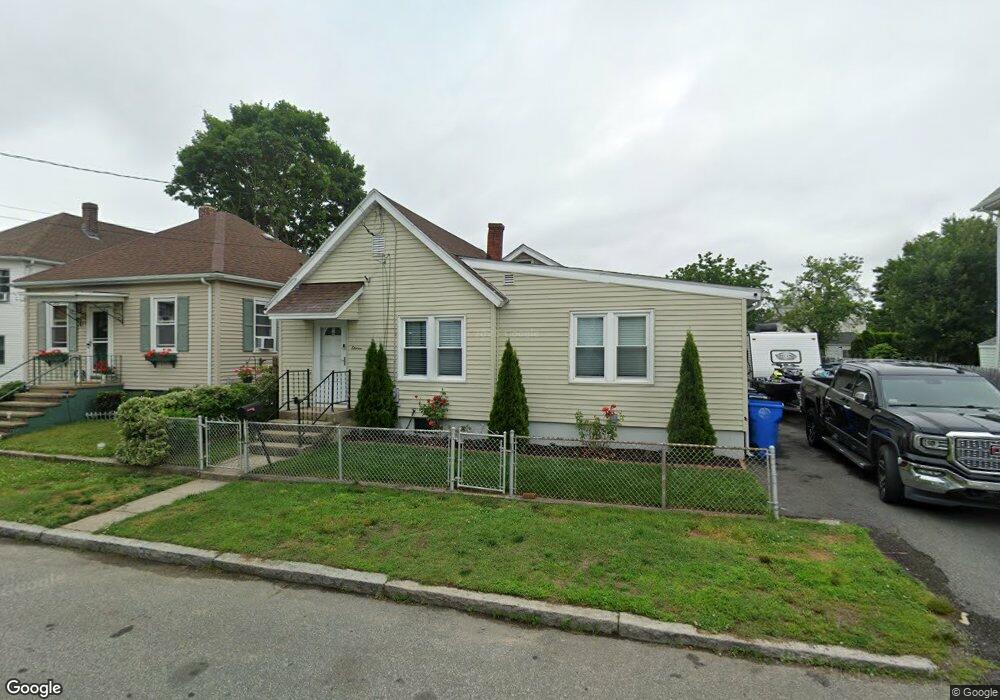
11 Sabra St Cranston, RI 02910
Spectacle NeighborhoodEstimated Value: $395,000 - $431,000
3
Beds
1
Bath
1,439
Sq Ft
$285/Sq Ft
Est. Value
About This Home
This home is located at 11 Sabra St, Cranston, RI 02910 and is currently estimated at $409,444, approximately $284 per square foot. 11 Sabra St is a home located in Providence County with nearby schools including Stadium Elementary School, Hugh B. Bain Middle School, and Cranston High School East.
Ownership History
Date
Name
Owned For
Owner Type
Purchase Details
Closed on
Nov 12, 2020
Sold by
Diaz Christopher
Bought by
Tejada Emmanuel
Current Estimated Value
Home Financials for this Owner
Home Financials are based on the most recent Mortgage that was taken out on this home.
Original Mortgage
$250,381
Outstanding Balance
$222,295
Interest Rate
2.8%
Mortgage Type
FHA
Estimated Equity
$187,149
Create a Home Valuation Report for This Property
The Home Valuation Report is an in-depth analysis detailing your home's value as well as a comparison with similar homes in the area
Home Values in the Area
Average Home Value in this Area
Purchase History
| Date | Buyer | Sale Price | Title Company |
|---|---|---|---|
| Tejada Emmanuel | $255,000 | None Available |
Source: Public Records
Mortgage History
| Date | Status | Borrower | Loan Amount |
|---|---|---|---|
| Open | Tejada Emmanuel | $250,381 |
Source: Public Records
Tax History Compared to Growth
Tax History
| Year | Tax Paid | Tax Assessment Tax Assessment Total Assessment is a certain percentage of the fair market value that is determined by local assessors to be the total taxable value of land and additions on the property. | Land | Improvement |
|---|---|---|---|---|
| 2025 | $4,356 | $313,800 | $97,200 | $216,600 |
| 2024 | $4,271 | $313,800 | $97,200 | $216,600 |
| 2023 | $4,009 | $212,100 | $67,000 | $145,100 |
| 2022 | $3,926 | $212,100 | $67,000 | $145,100 |
| 2021 | $3,818 | $212,100 | $67,000 | $145,100 |
| 2020 | $3,381 | $162,800 | $63,700 | $99,100 |
| 2019 | $3,381 | $162,800 | $63,700 | $99,100 |
| 2018 | $3,303 | $162,800 | $63,700 | $99,100 |
| 2017 | $2,826 | $123,200 | $46,900 | $76,300 |
| 2016 | $2,766 | $123,200 | $46,900 | $76,300 |
| 2015 | $2,766 | $123,200 | $46,900 | $76,300 |
| 2014 | $1,993 | $118,600 | $46,900 | $71,700 |
Source: Public Records
Map
Nearby Homes
- 41 Cottage St
- 26 Westmore St
- 11 Togansett Rd
- 444 Niantic Ave
- 6 Tobyhanna St
- 136 Frankfort St
- 41 Gleason St
- 166 Midwood St
- 128 Elsie St
- 74 Leslie St
- 140 Eldridge St
- 210 Crescent Ave
- 16 Winthrop St
- 145 Harmon Ave
- 165 Rounds Ave
- 32 Stadden St
- 12 Winthrop St
- 60 Lowell St
- 29 Crescent St
- 137 Rutherglen Ave